-
JavaScript Tutorial
JavaScript Basics
- js-comment
- js-variable
- js-global-variable
- js-data-types
- js-operators
- js-if-statement
- js-switch
- js-loop
- js-function
JavaScript Objects
JavaScript BOM
JavaScript DOM
- 5)-document-object
- getelementbyid
- getelementsbyclassname()
- getelementsbyname
- getelementsbytagname
- js-innerhtml-property
- js-innertext-property
JavaScript Validation
JavaScript OOPs
- js-class
- js-object
- js-prototype
- js-constructor-method
- js-static-method
- js-encapsulation
- js-inheritance
- js-polymorphism
- js-abstraction
JavaScript Cookies
JavaScript Events
- javascript-events
- javascript-addeventlistener()
- js-onclick-event
- js-dblclick-event
- js-onload-event
- js-onresize-event
Exception Handling
JavaScript Misc
- js-this-keyword
- js-debugging
- js-hoisting
- js-strict-mode
- javascript-promise
- js-compare-dates
- javascript-array.length
- javascript-alert()
- javascript-eval()-function
- javascript-closest()
- javascript-continue-statement
- js-getattribute()-method
- js-hide-elements
- javascript-prompt()
- removeattribute()-method
- javascript-reset
- javascript-return
- js-string-split()
- js-typeof-operator
- js-ternary-operator
- js-reload()-method
- js-setattribute()-method
- js-setinterval()-method
- js-settimeout()-method
- js-string-includes()-method
- calculate-current-week-number-in-javascript
- calculate-days-between-two-dates-in-javascript
- javascript-string-trim()
- javascript-timer
- remove-elements-from-array
- javascript-localstorage
- javascript-offsetheight
- confirm-password-validation
- static-vs-const
- how-to-convert-comma-separated-string-into-an-array-in-javascript
- calculate-age-using-javascript
- javascript-label-statement
- javascript-string-with-quotes
- how-to-create-dropdown-list-using-javascript
- how-to-disable-radio-button-using-javascript
JavaScript Advance
- js-typedarray
- js-set
- js-map
- js-weakset
- js-weakmap
- javascript-callback
- javascript-closures
- javascript-date-difference
- javascript-date-format
- js-date-parse()-method
- javascript-defer
- javascript-redirect
- javascript-scope
- javascript-scroll
- javascript-sleep
- javascript-void
- javascript-form
Differences
Questions
- how-to-add-javascript-to-html
- how-to-enable-javascript-in-my-browser
- difference-between-java-and-javascript
- how-to-call-javascript-function-in-html
- how-to-write-a-function-in-javascript
- is-javascript-case-sensitive
- how-does-javascript-work
- how-to-debug-javascript
- how-to-enable-javascript-on-android
- what-is-a-promise-in-javascript
- what-is-hoisting-in-javascript
- what-is-vanilla-javascript
- how-to-add-a-class-to-an-element-using-javascript
- how-to-calculate-the-perimeter-and-area-of-a-circle-using-javascript
- how-to-create-an-image-map-in-javascript
- how-to-find-factorial-of-a-number-in-javascript
- how-to-get-the-value-of-pi-using-javascript
- how-to-make-a-text-italic-using-javascript
- what-are-the-uses-of-javascript
- how-to-get-all-checked-checkbox-value-in-javascript
- how-to-open-json-file
- random-image-generator-in-javascript
- how-to-add-object-in-array-using-javascript
- javascript-window-open-method
- javascript-window-close-method
- how-to-check-a-radio-button-using-javascript
- javascript-const
- javascript-function-to-check-array-is-empty-or-not
- javascript-multi-line-string
- javascript-anonymous-functions
- implementing-javascript-stack-using-array
- javascript-classlist
- javascript-code-editors
- javascript-let-keyword
- random-string-generator-using-javascript
- javascript-queue
- event-bubbling-and-capturing-in-javascript
- how-to-select-all-checkboxes-using-javascript
- javascript-change-event
- javascript-focusout-event
- traverse-array-object-using-javascript
- javascript-create-and-download-csv-file
- how-to-make-beep-sound-in-javascript
- how-to-add-a-whatsapp-share-button-in-a-website-using-javascript
- javascript-execution-context
- javascript-queryselector
- shallow-copy-in-javascript
- how-to-toggle-password-visibility-in-javascript
- removing-duplicate-from-arrays
- javascript-insertbefore
- javascript-select-option
Interview Questions
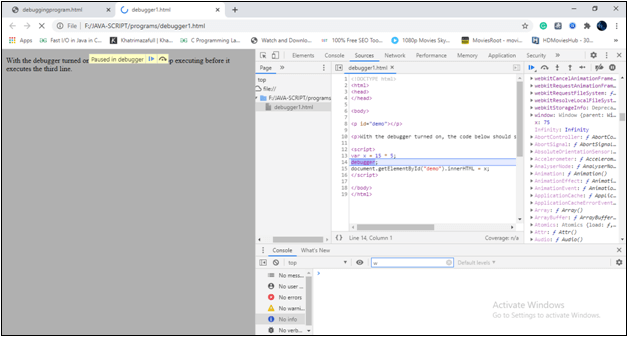
How to debug JavaScript?Before understanding 'how to debug JavaScript', we have to understand the term "debugging". What is Code Debugging?While coding or writing the program, we can make many mistakes, such as logical errors, syntax errors, etc. A debugging allows us to find the location/point where an error has occurred because in the debugging, we can execute our code as one line at a time. Once we find the point where we have made a mistake, we can make appropriate changes to correct the mistakes. The debug tools also allow us to make temporary changes to the program's code. This entire process of correcting a code after finding out the errors is `QAZ!qknown as debugging. In short, we can say that Code Debugging is a process of finding and correcting the programming errors. JavaScript DebuggersAs it is evident that debugging is not an easy task because it requires a lot of practice and experience, so fortunately all modern web-browsers have their own built-in Debuggers. The web-browser gives us the control to turn on or off the Debugging whenever we wanted to use it and it also allows us to set breakpoints (where the execution of the program's code can stop) and we can examine the variable when the code is executing. Generally, we can open the built-in JavaScript debugging with F12 Key to display the JavaScript values by using "console". The console.log () Method We can use the console.log() method for displaying the JavaScript values only if the browser supports debugging. Syntax of console method We can understand it more clearly with the help of an example: Program How to set breakpoints? While using a debugging, we can set the breaking points in the program's code of the JavaScript. When the control reaches any breaking point, the execution of the program gets stopped and allows us to examine the JavaScript values. Once we examined the JavaScript values and are satisfied, we can resume the execution of the program by pressing the play button. The debugger Keyword We can stop the execution of the program on any line by using the "debugger;" keyword. However, this keyword will work only if the debugger function is available. Also, we can check the JavaScript values if the debugger function is available. Once we are done with examining the JavaScript values, we can resume the execution and can search for other mistakes to correct them. Syntax Program Explanation of programIn above program, we have created a variable x in which we have multiplied 15 into 5 and used the debugger keyword for setting up a breaking point. When we perform the debugging process, the execution of program will stop at that line, and we can examine the value. If any changes are not required, then we can resume the execution. Let's see an example with practical
 Let us see how you can open the console on different modern browsers These are the following five major modern browsers that support debugging. Chrome
Firefox
Edge
Opera
Safari
Next TopicHow to Enable JavaScript on Android
|