There are two easy ways to change the legend title in a ggplot2 chart:
Method 1: Use labs()
ggplot(data, aes(x=x_var, y=y_var, fill=fill_var)) +
  geom_boxplot() +
  labs(fill='Legend Title')
Method 2: Use scale_fill_manual()
ggplot(data, aes(x=x_var, y=y_var, fill=fill_var)) +
  geom_boxplot() +
  scale_fill_manual('Legend Title', values=c('color1', 'color2'))
This tutorial shows examples of how to use these two methods in practice.
Method 1: Change Legend Title Using labs()
The following code shows how to create a grouped boxplot for a given dataset:
library(ggplot2)

#create dataset
data rep(c('A', 'B', 'C'), each=50),
                   program=rep(c('low', 'high'), each=25),
                   values=seq(1:150)+sample(1:100, 150, replace=TRUE))

#create boxplot
ggplot(data, aes(x=team, y=values, fill=program)) +
  geom_boxplot()

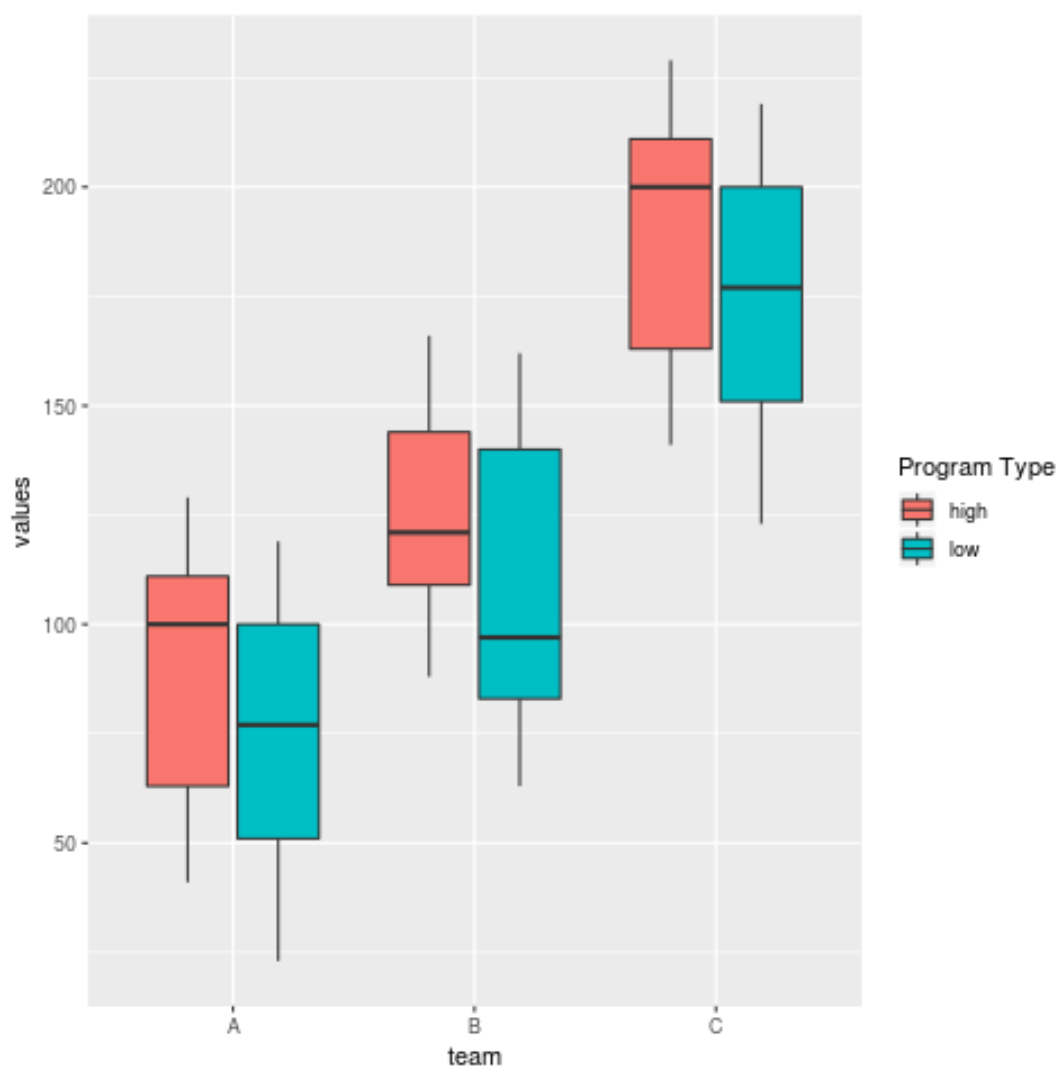
By default, ggplot2 uses the variable name in the dataset as the legend title. However, we can use the labs() function to easily change it:
library(ggplot2)

#create dataset
data rep(c('A', 'B', 'C'), each=50),
                   program=rep(c('low', 'high'), each=25),
                   values=seq(1:150)+sample(1:100, 150, replace=TRUE))

#create boxplot
ggplot(data, aes(x=team, y=values, fill=program)) +
  geom_boxplot() +
  labs(fill='Program Type')
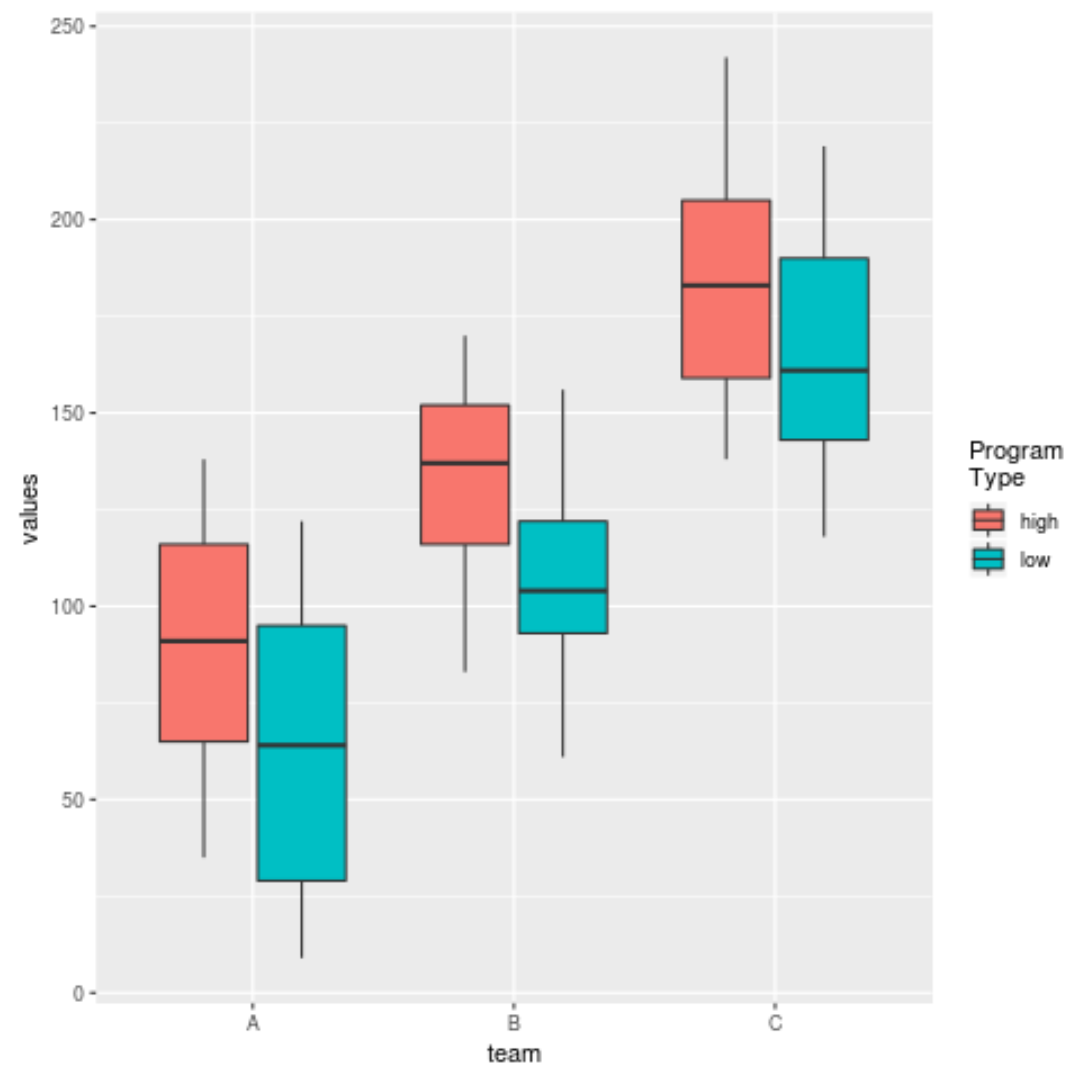
We can also add a line break in the legend title by placing n wherever we’d like the new line to start:
library(ggplot2)

#create dataset
data rep(c('A', 'B', 'C'), each=50),
                   program=rep(c('low', 'high'), each=25),
                   values=seq(1:150)+sample(1:100, 150, replace=TRUE))

#create boxplot
ggplot(data, aes(x=team, y=values, fill=program)) +
  geom_boxplot() +
  labs(fill='ProgramnType')
Method 2: Change Legend Title Using scale_fill_manual()
We can also use the scale_fill_manual() function to simultaneously specify a legend title and a vector of color values to use:
library(ggplot2)

#create dataset
data rep(c('A', 'B', 'C'), each=50),
                   program=rep(c('low', 'high'), each=25),
                   values=seq(1:150)+sample(1:100, 150, replace=TRUE))

#create boxplot
ggplot(data, aes(x=team, y=values, fill=program)) +
  geom_boxplot() +
  scale_fill_manual('Program Type', values=c('pink','blue'))
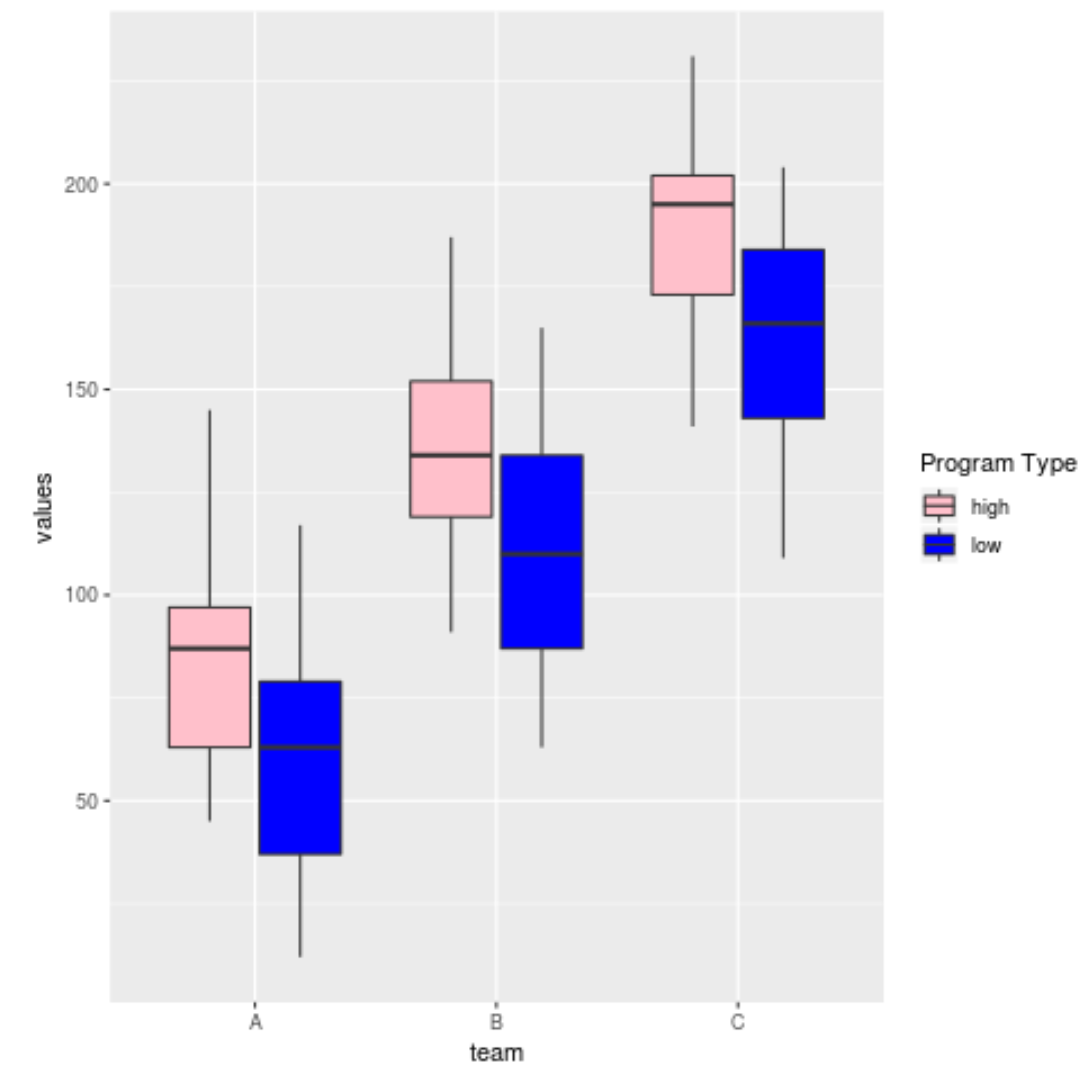
Note that the values for the colors can either be names or hex color codes.
Additional Resources
A Complete Guide to the Best ggplot2 Themes
The Complete Guide to ggplot2 Titles
How to Create Side-by-Side Plots in ggplot2