A stem-and-leaf plot displays data by splitting up each value in a dataset into a stem and a leaf. It’s a useful plot for easily visualizing the distribution of a dataset.
This tutorial explains how to create a stem-and-leaf plot in SPSS.
Example: Stem-and-Leaf Plot in SPSS
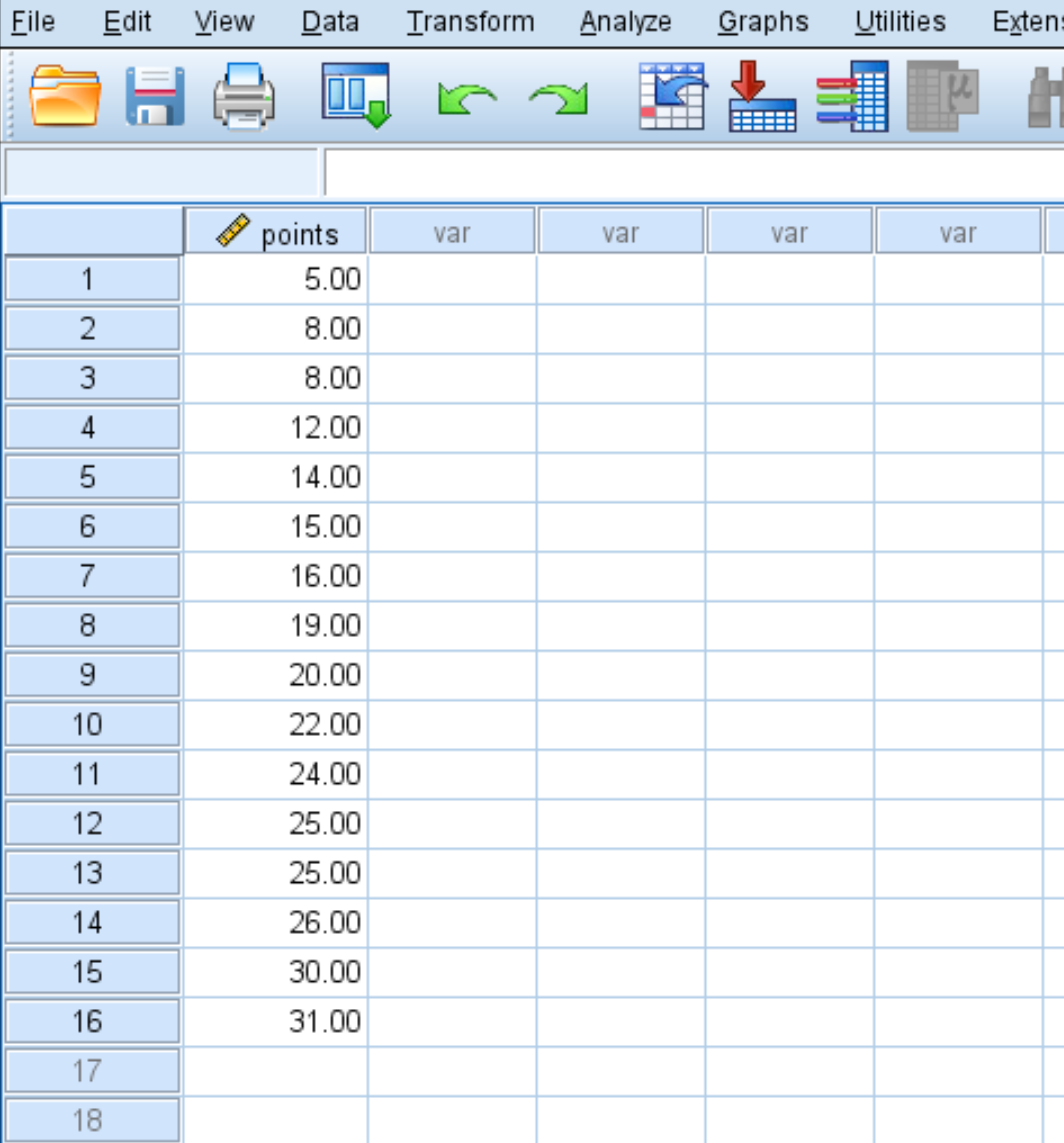
Suppose we have the following dataset that shows the average points per game for 16 basketball players:
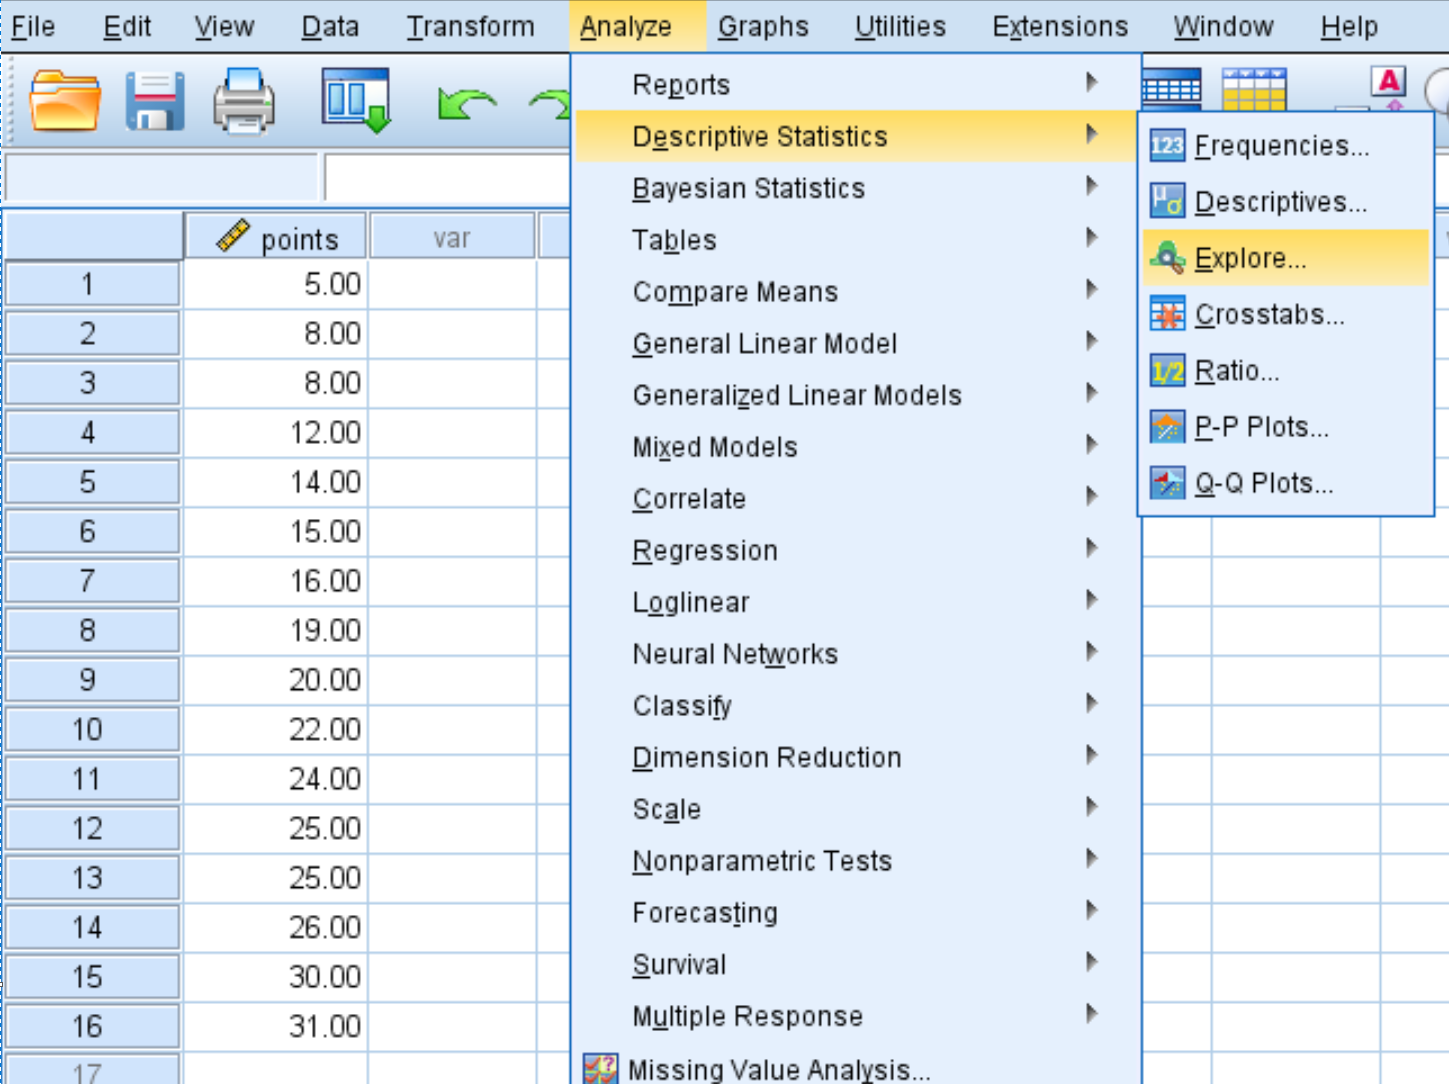
To create a stem-and-leaf plot for this dataset, click the Analyze tab, then Descriptive Statistics, then Explore.
This will bring up the following window:
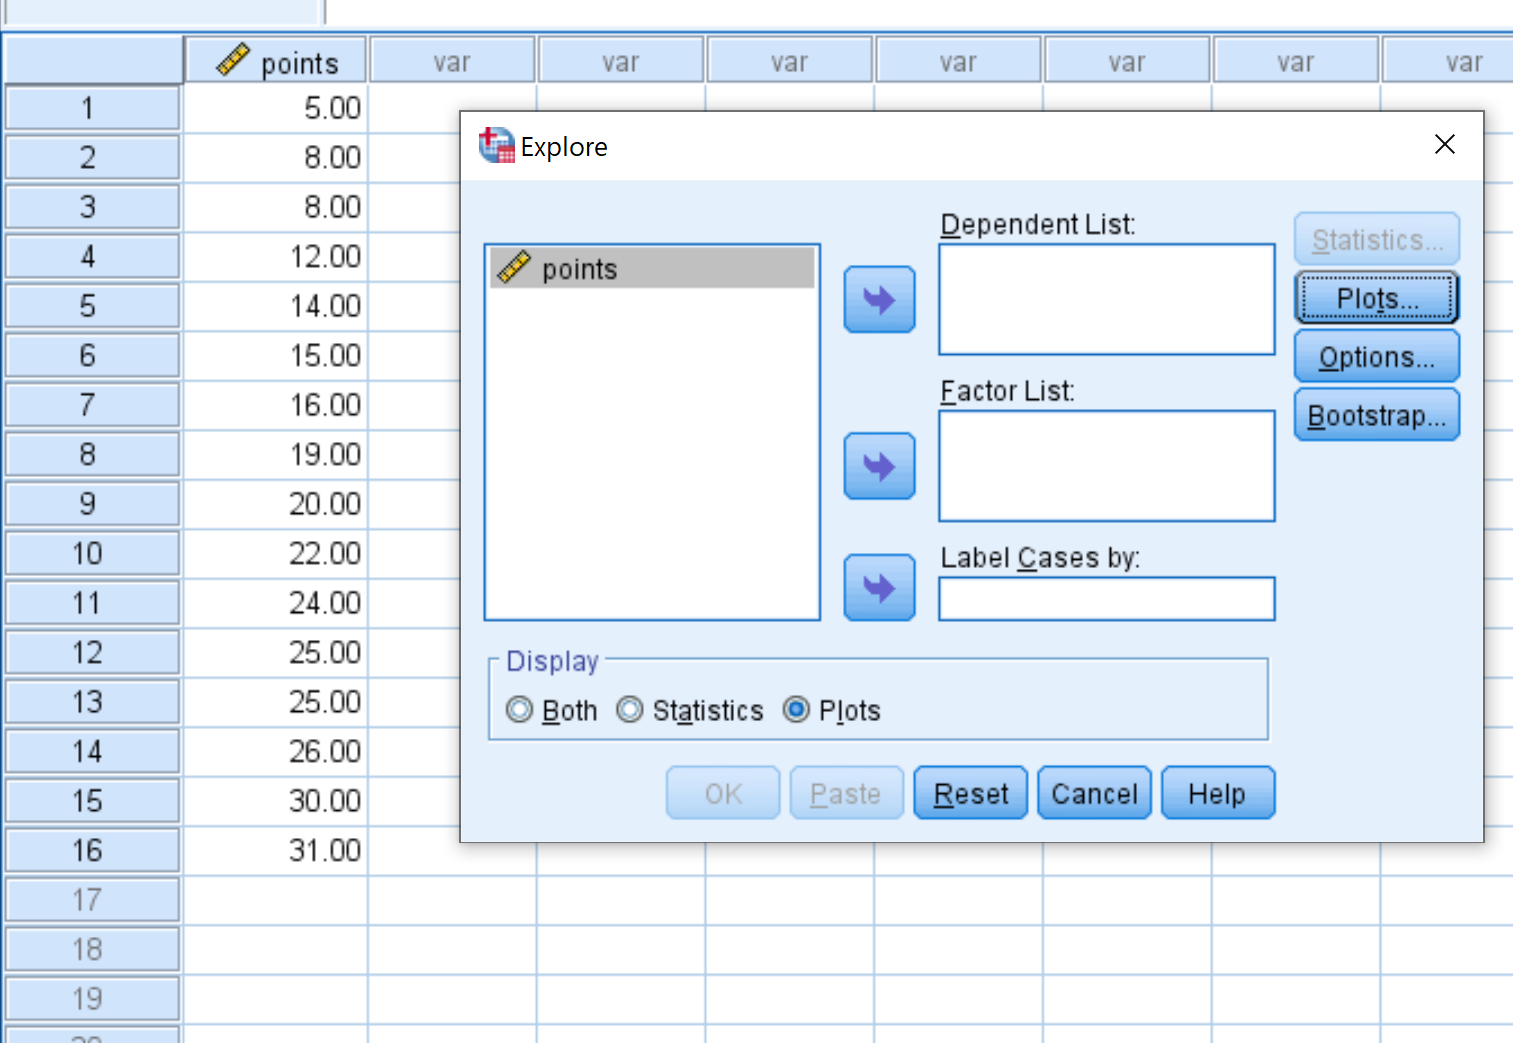
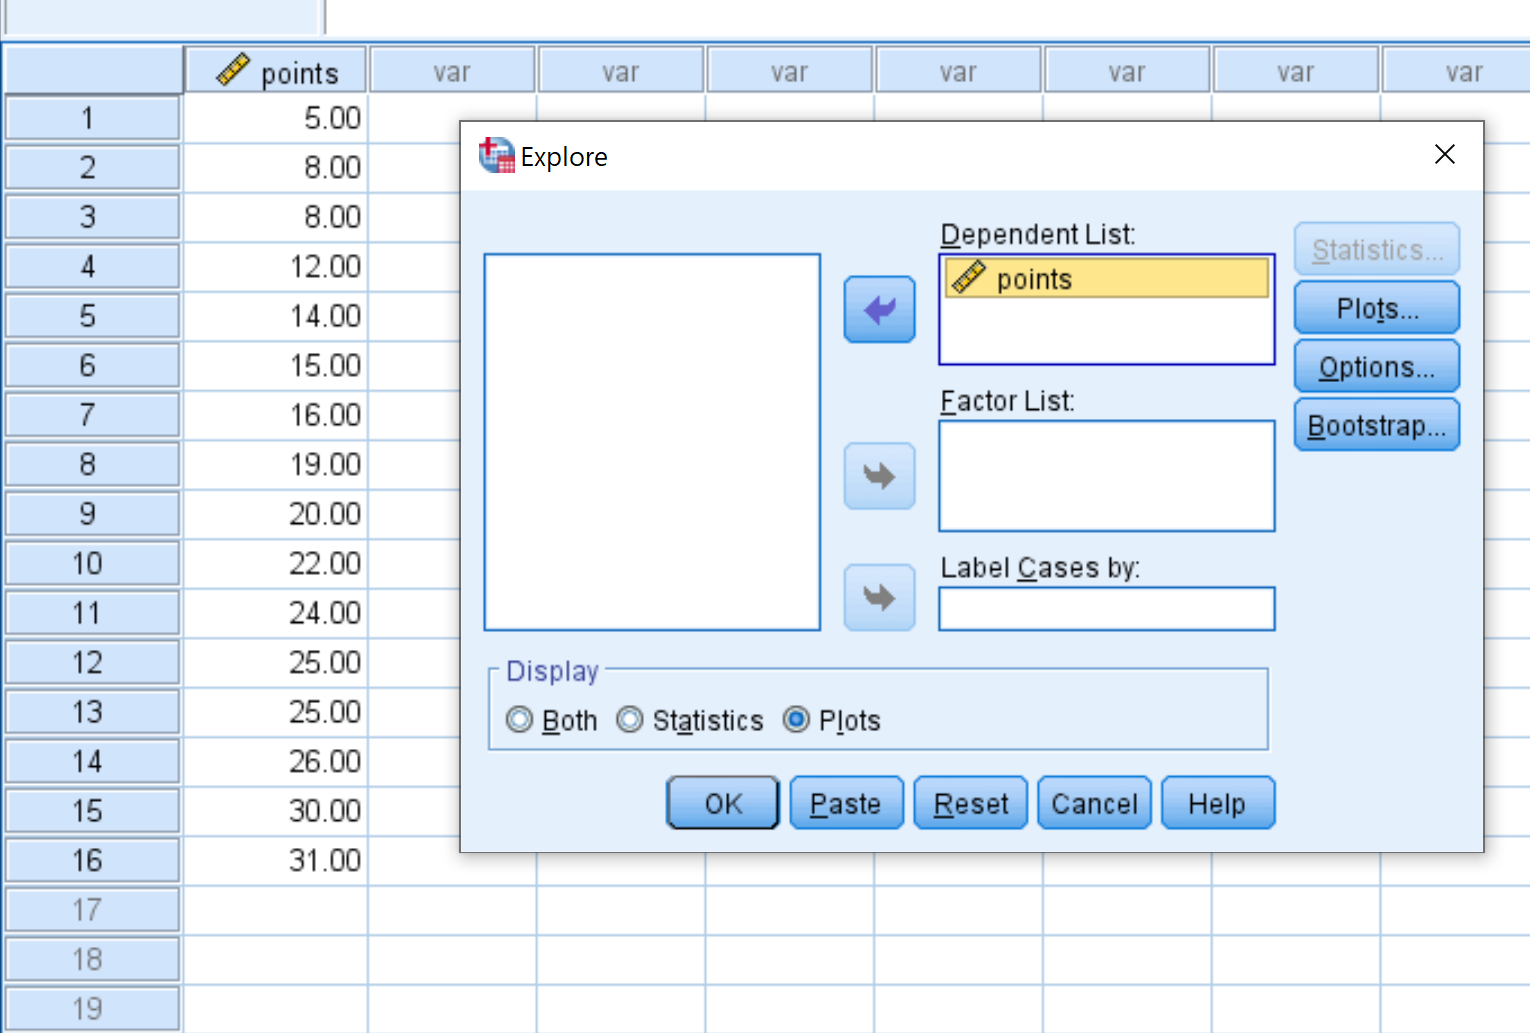
To create a stem-and-leaf plot, we need to drag the variable points into the box labelled Dependent List. Then we need to make sure Plots is selected under the option that says Display near the bottom of the box.
Once we click OK, the following stem-and-leaf plot will appear:
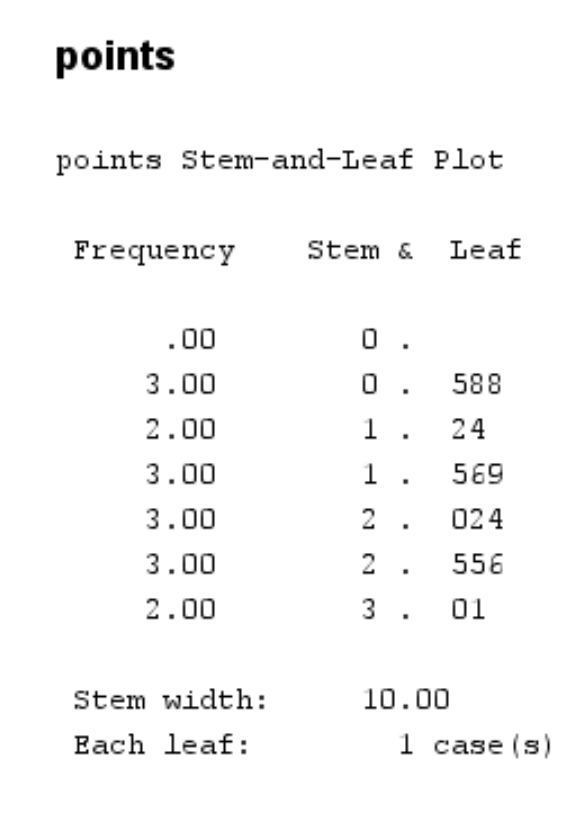
The Stem column displays the first digit for each data value while the Leaf column displays the second digit.
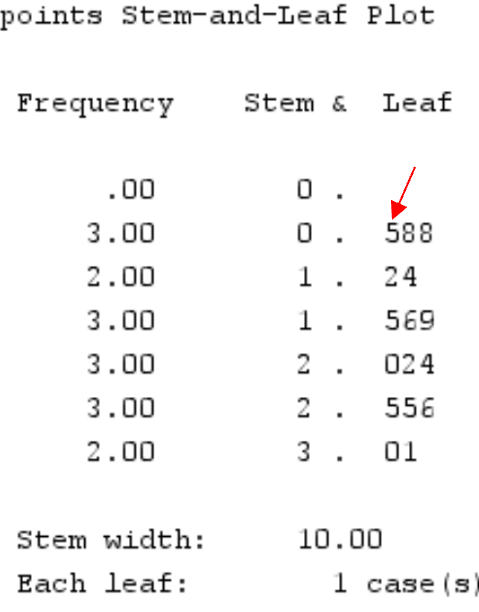
For example, the first leaf shown in the first row represents the player who averages 5 points per game:
And the last leaf shown in the last row represents the player who averages 31 points per game:
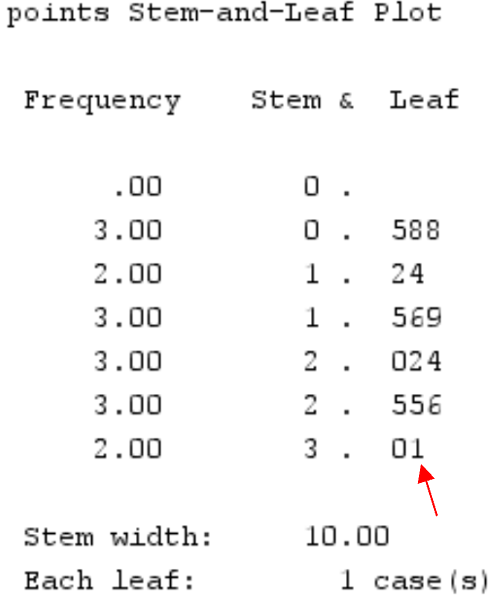
This simple plot helps us get an idea of the distribution of the points scored by the 16 players in this dataset.