82
You can use the following syntax to create multiple Matplotlib plots in one figure:
import matplotlib.pyplot as plt

#define grid of plots
fig, axs = plt.subplots(nrows=2, ncols=1)

#add data to plots
axs[0].plot(variable1, variable2)
axs[1].plot(variable3, variable4)
The following examples show how to use this function in practice.
Example 1: Stack Plots Vertically
The following code shows how to create three Matplotlib plots, stacked vertically:
#create some data
var1 = [1, 2, 3, 4, 5, 6]
var2 = [7, 13, 16, 18, 25, 19]
var3 = [29, 25, 20, 25, 20, 18]

#define grid of plots
fig, axs = plt.subplots(nrows=3, ncols=1)

#add title
fig.suptitle('Plots Stacked Vertically')

#add data to plots
axs[0].plot(var1, var2)
axs[1].plot(var1, var3)
axs[2].plot(var2, var3)

Example 2: Stack Plots Horizontally
The following code shows how to create three Matplotlib plots, stacked horizontally:
#create some data
var1 = [1, 2, 3, 4, 5, 6]
var2 = [7, 13, 16, 18, 25, 19]
var3 = [29, 25, 20, 25, 20, 18]

#define grid of plots
fig, axs = plt.subplots(nrows=1, ncols=3)

#add title
fig.suptitle('Plots Stacked Horizontally')

#add data to plots
axs[0].plot(var1, var2)
axs[1].plot(var1, var3)
axs[2].plot(var2, var3) 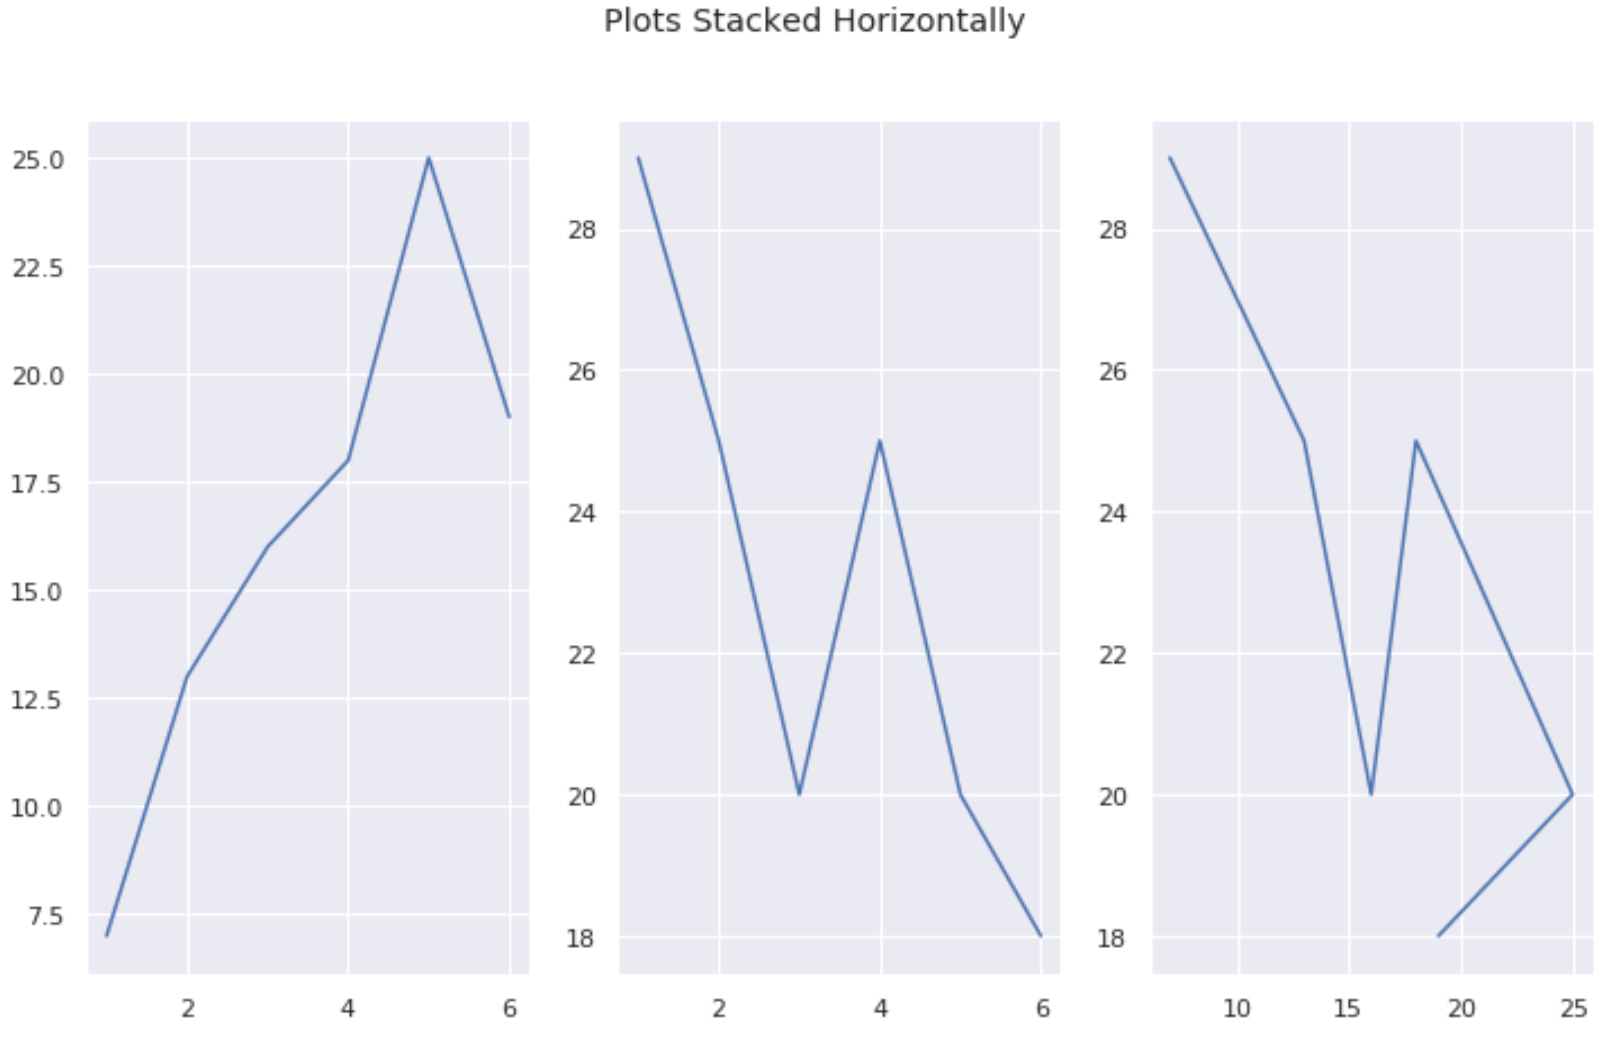
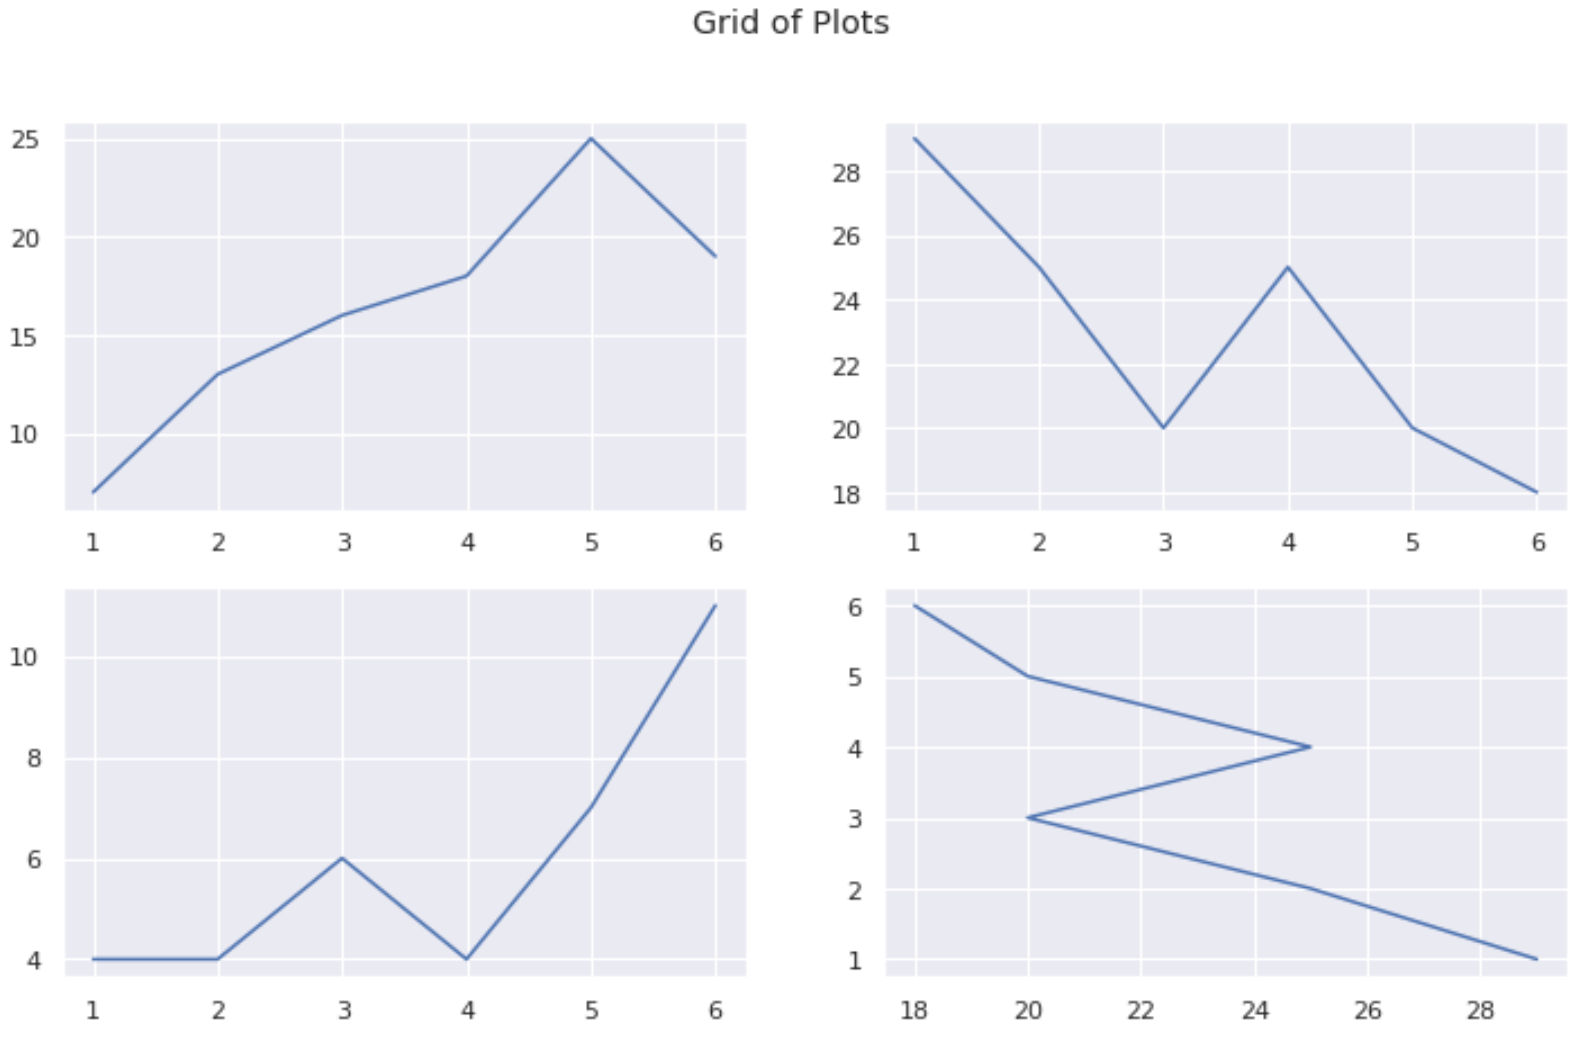
Example 3: Create a Grid of Plots
The following code shows how to create a grid of Matplotlib plots:
#create some data
var1 = [1, 2, 3, 4, 5, 6]
var2 = [7, 13, 16, 18, 25, 19]
var3 = [29, 25, 20, 25, 20, 18]
var4 = [4, 4, 6, 4, 7, 11]

#define grid of plots
fig, axs = plt.subplots(nrows=2, ncols=2)

#add title
fig.suptitle('Grid of Plots')

#add data to plots
axs[0, 0].plot(var1, var2)
axs[0, 1].plot(var1, var3)
axs[1, 0].plot(var1, var4)
axs[1, 1].plot(var3, var1)
Example 4: Share Axes Between Plots
You can use the sharex and sharey arguments to ensure that multiple plots use the same x-axis:
#create some data
var1 = [1, 2, 3, 4, 5, 6]
var2 = [7, 13, 16, 18, 25, 19]
var3 = [29, 25, 20, 25, 20, 18]
var4 = [4, 4, 6, 4, 7, 11]

#define grid of plots
fig, axs = plt.subplots(nrows=2, ncols=2, sharex=True, sharey=True)

#add title
fig.suptitle('Grid of Plots with Same Axes')

#add data to plots
axs[0, 0].plot(var1, var2)
axs[0, 1].plot(var1, var3)
axs[1, 0].plot(var1, var4)
axs[1, 1].plot(var3, var1) 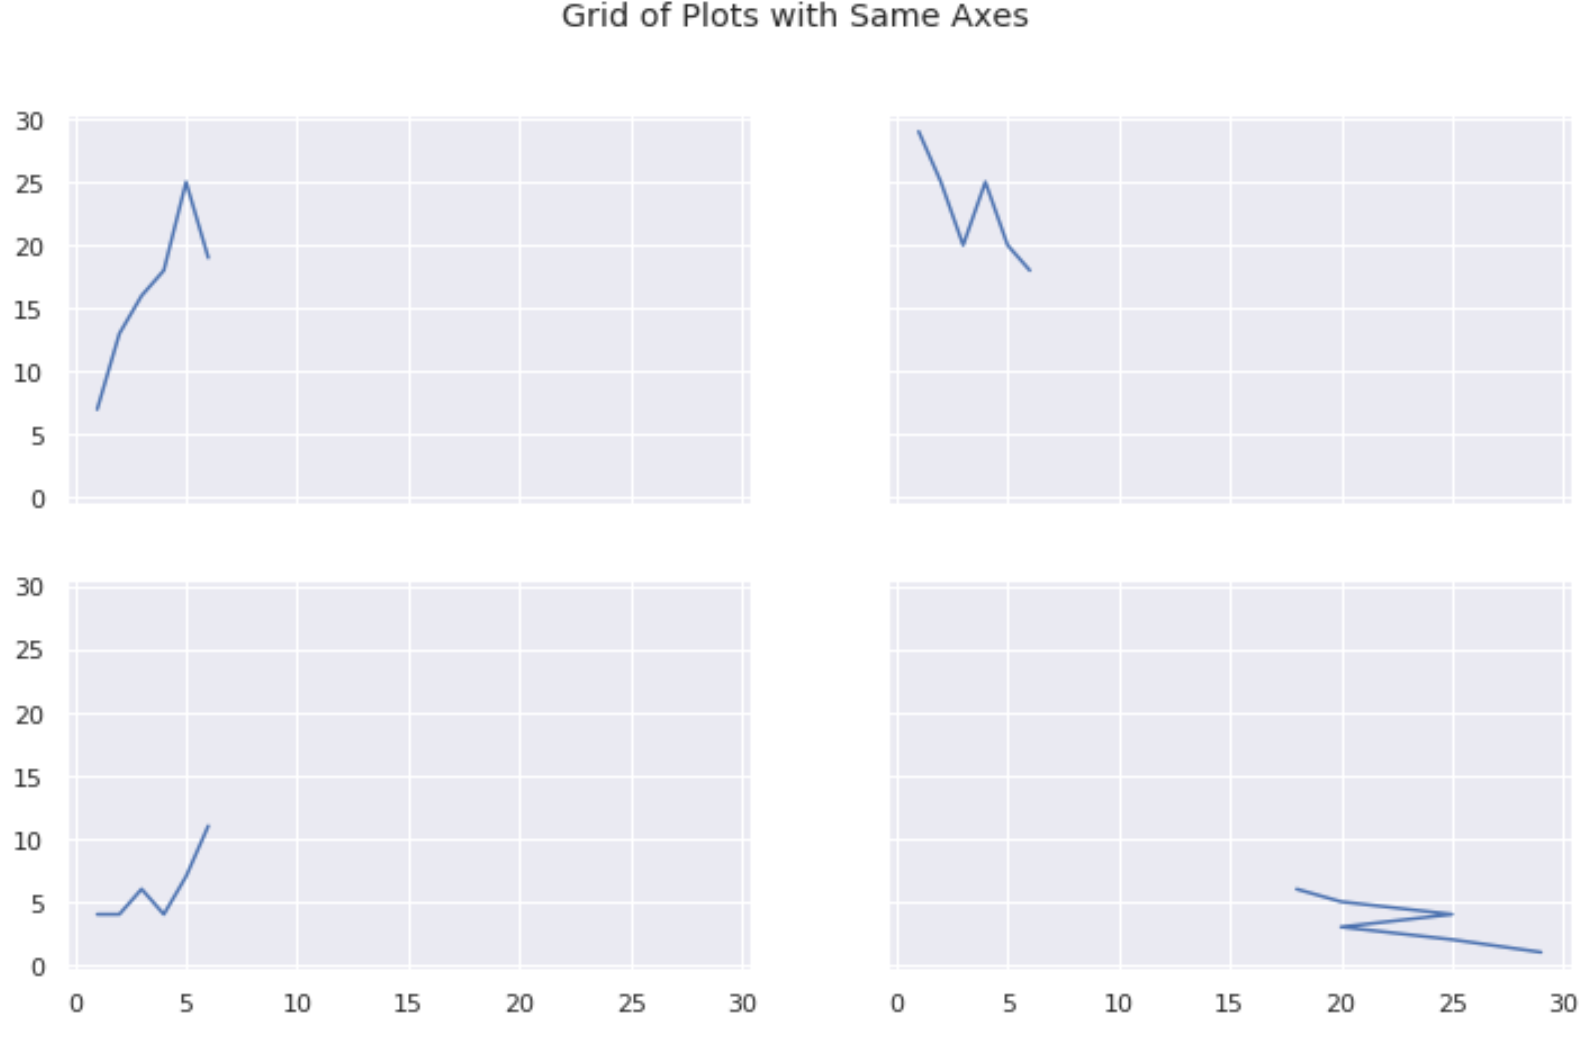
Additional Resources
How to Adjust Spacing Between Matplotlib Subplots
How to Change Background Color in Matplotlib
How to Increase Plot Size in Matplotlib