The t distribution is a probability distribution that is similar to the normal distribution except it has heavier “tails” than the normal distribution.
That is, more values in the distribution are located in the tail ends than the center compared to the normal distribution:

This tutorial explains how to use the t distribution in Python.
How to Generate a t Distribution
You can use the t.rvs(df, size) function to generate random values from a t distribution with a specific degrees of freedom and sample size:
from scipy.stats import t

#generate random values from t distribution with df=6 and sample size=10
t.rvs(df=6, size=10)

array([-3.95799716, -0.01099963, -0.55953846, -1.53420055, -1.41775611,
       -0.45384974, -0.2767931 , -0.40177789, -0.3602592 ,  0.38262431])
The result is an array of 10 values that follow a t distribution with 6 degrees of freedom.
How to Calculate P-Values Using t Distribution
We can use the t.cdf(x, df, loc=0, scale=1) function to find the p-value associated with some t test statistic.
Example 1: Find One-Tailed P-Value
Suppose we perform a one-tailed hypothesis test and end up with a t test statistic of -1.5 and degrees of freedom = 10.
We can use the following syntax to calculate the p-value that corresponds to this test statistic:
from scipy.stats import t

#calculate p-value
t.cdf(x=-1.5, df=10)

0.08225366322272008
The one-tailed p-value that corresponds to a t test statistic of -1.5 with 10 degrees of freedom is 0.0822.
Example 2: Find Two-Tailed P-Value
Suppose we perform a two-tailed hypothesis test and end up with a t test statistic of 2.14 and degrees of freedom = 20.
We can use the following syntax to calculate the p-value that corresponds to this test statistic:
from scipy.stats import t

#calculate p-value
(1 - t.cdf(x=2.14, df=20)) * 2

0.04486555082549959
The two-tailed p-value that corresponds to a t test statistic of 2.14 with 20 degrees of freedom is 0.0448.
Note: You can double check these answers by using the Inverse t Distribution Calculator.
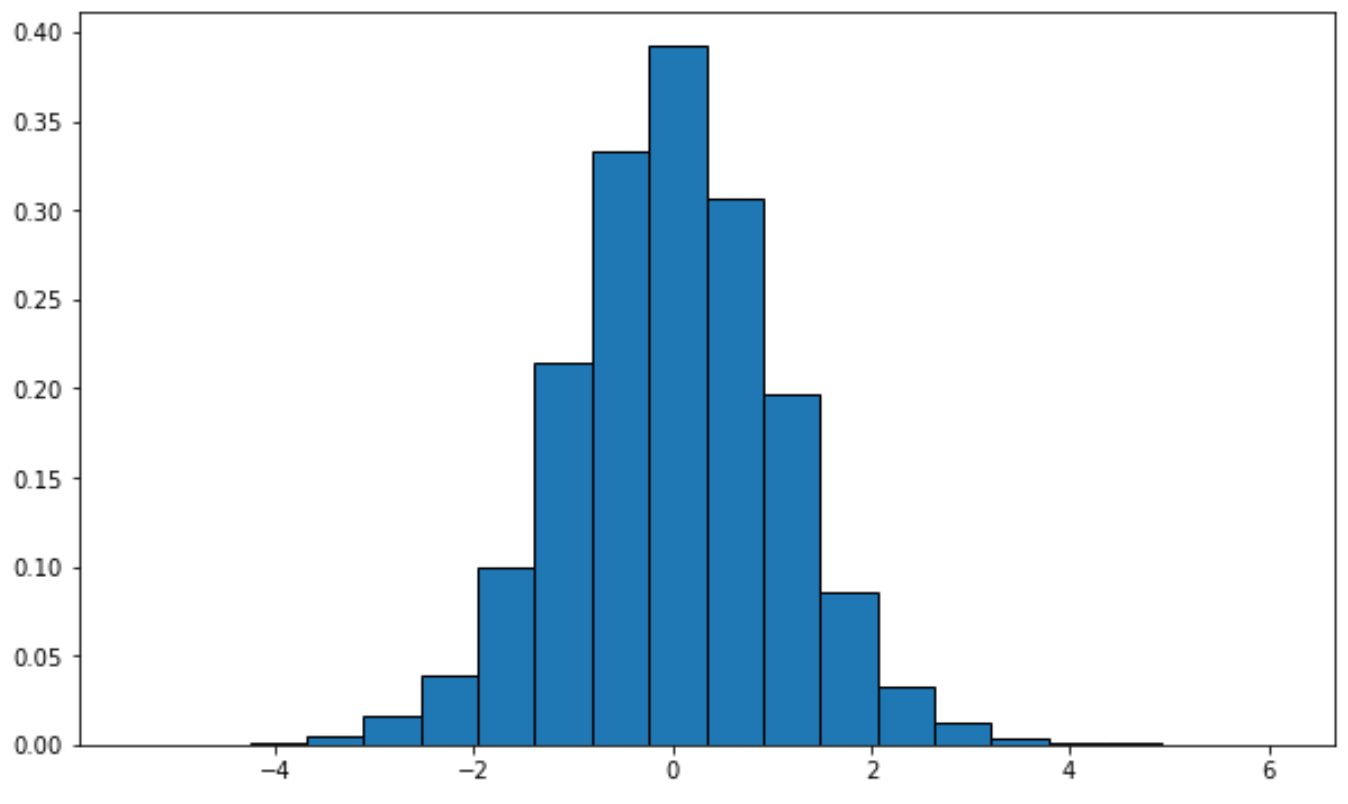
How to Plot a t Distribution
You can use the following syntax to plot a t distribution with a specific degrees of freedom:
from scipy.stats import t
import matplotlib.pyplot as plt

#generate t distribution with sample size 10000
x = t.rvs(df=12, size=10000)

#create plot of t distribution
plt.hist(x, density=True, edgecolor='black', bins=20)
Alternatively, you can create a density curve using the seaborn visualization package:
import seaborn as sns

#create density curve
sns.kdeplot(x)

Additional Resources
The following tutorials offer additional information about the t distribution:
Normal Distribution vs. t-Distribution: What’s the Difference?
Inverse t Distribution Calculator