69
You can use the following basic syntax to calculate the cumulative distribution function (CDF) in Python:
#sort data
x = np.sort(data)

#calculate CDF values
y = 1. * np.arange(len(data)) / (len(data) - 1)

#plot CDF
plt.plot(x, y)
The following examples show how to use this syntax in practice.
Example 1: CDF of Random Distribution
The following code shows how to calculate and plot a cumulative distribution function (CDF) for a random sample of data in Python:
import numpy as np
import matplotlib.pyplot as plt

#define random sample of data
data = np.random.randn(10000)

#sort data
x = np.sort(data)

#calculate CDF values
y = 1. * np.arange(len(data)) / (len(data) - 1)

#plot CDF
plt.plot(x, y)
plt.xlabel('x')

The x-axis displays the raw data values and the y-axis displays the corresponding CDF values.
Example 2: CDF of Normal Distribution
If you’d like to plot the cumulative distribution function of a known distribution (such as the normal distribution) then you can use the following functions from the SciPy library:
import numpy as np
import scipy
import matplotlib.pyplot as plt

#generate data from normal distribution
data = np.random.randn(1000)

#sort data
x = np.sort(data)

#calculate CDF values
y = scipy.stats.norm.cdf(x)

#plot CDF
plt.plot(data_sorted, norm_cdf)

#plot CDF
plt.plot(x, y)
plt.xlabel('x') 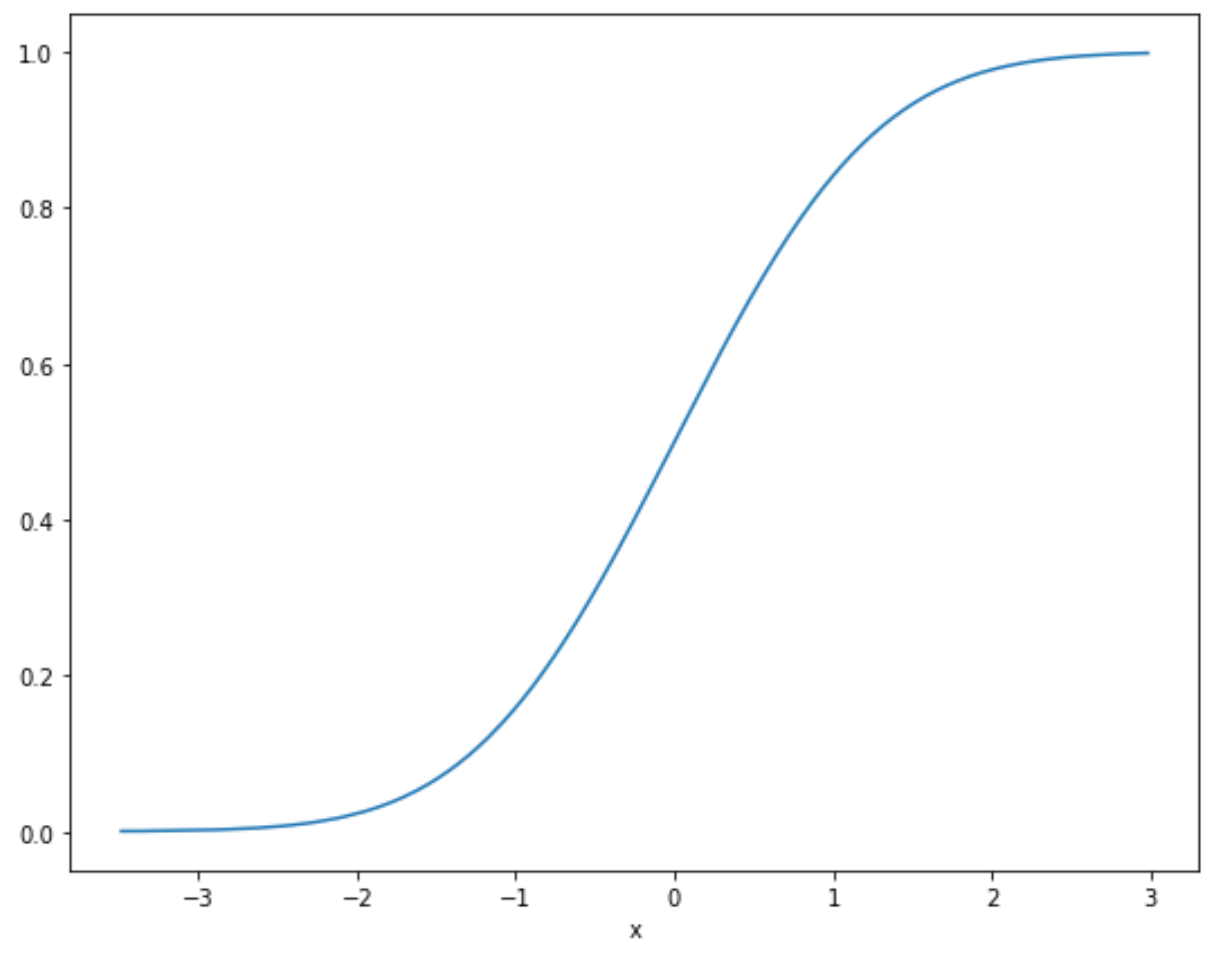
Additional Resources
CDF vs. PDF: What’s the Difference?
How to Make a Bell Curve in Python
How to Calculate Z-Scores in Python