Often you may want to calculate the average value grouped by month in Google Sheets.
For example, suppose we have the following dataset and we’d like to calculate the average daily sales, grouped by month:

The following step-by-step example shows how to do so.
Step 1: Enter the Data
First, enter the data values into Google Sheets:
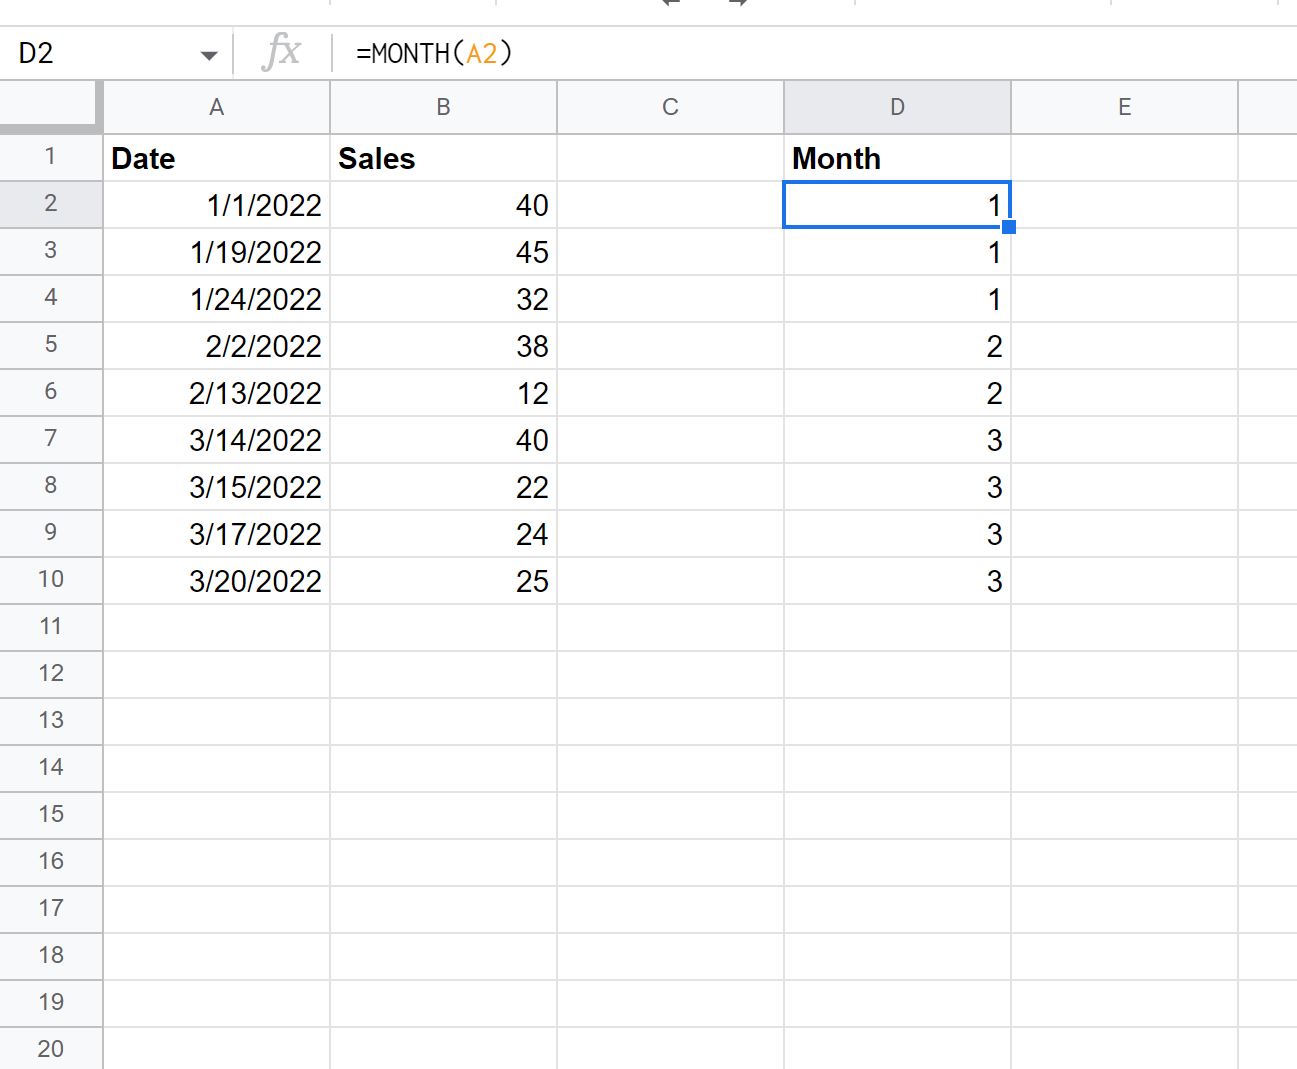
Step 2: Extract the Month from Dates
Next, we need to use the =MONTH() function to extract the month from each date.
In our example, we’ll type the following formula in cell D2:
=MONTH(A2)
We’ll then drag and fill this formula down to every remaining cell in column D:
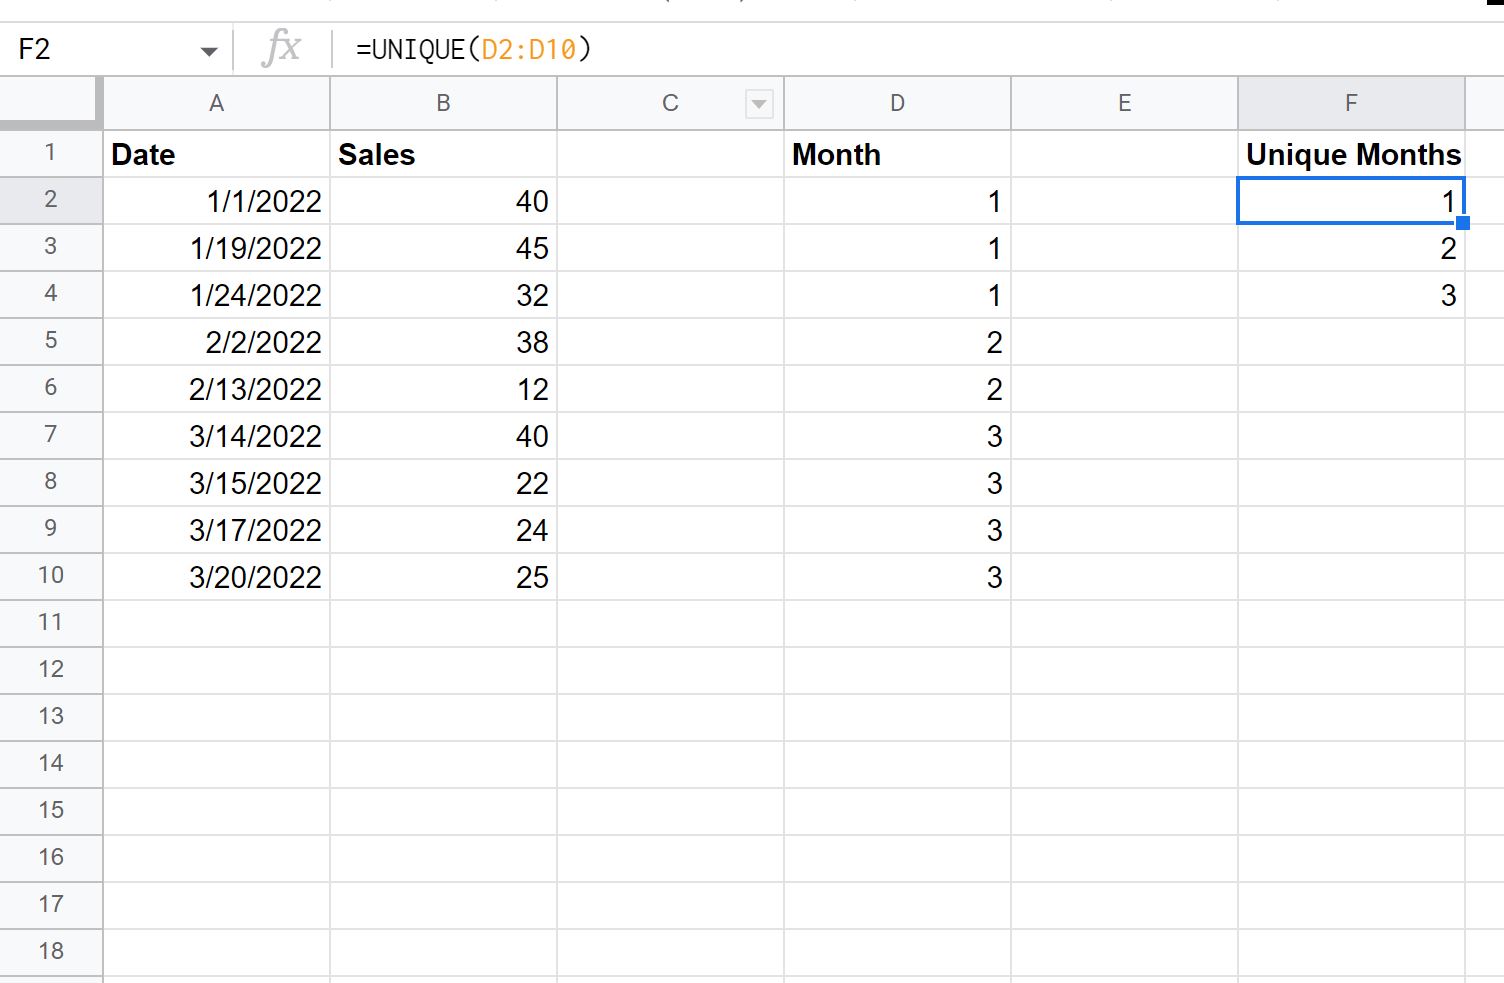
Step 3: Find the Unique Months
Next, we need to use the =UNIQUE() function to produce a list of unique months.
In our example, we’ll type the following formula in cell F2:
=UNIQUE(D2:D10)
This will produce a list of unique months:
Step 4: Calculate the Average by Month
Next, we will use the AVERAGEIF(range, criterion, average_range) function to find the average of the daily sales values, grouped by month.
In our example, we’ll type the following formula in cell G2:
=AVERAGEIF($D$2:$D$10, F2, $B$2:$B$10)
We’ll then drag and fill this formula down to the remaining cells in column G:
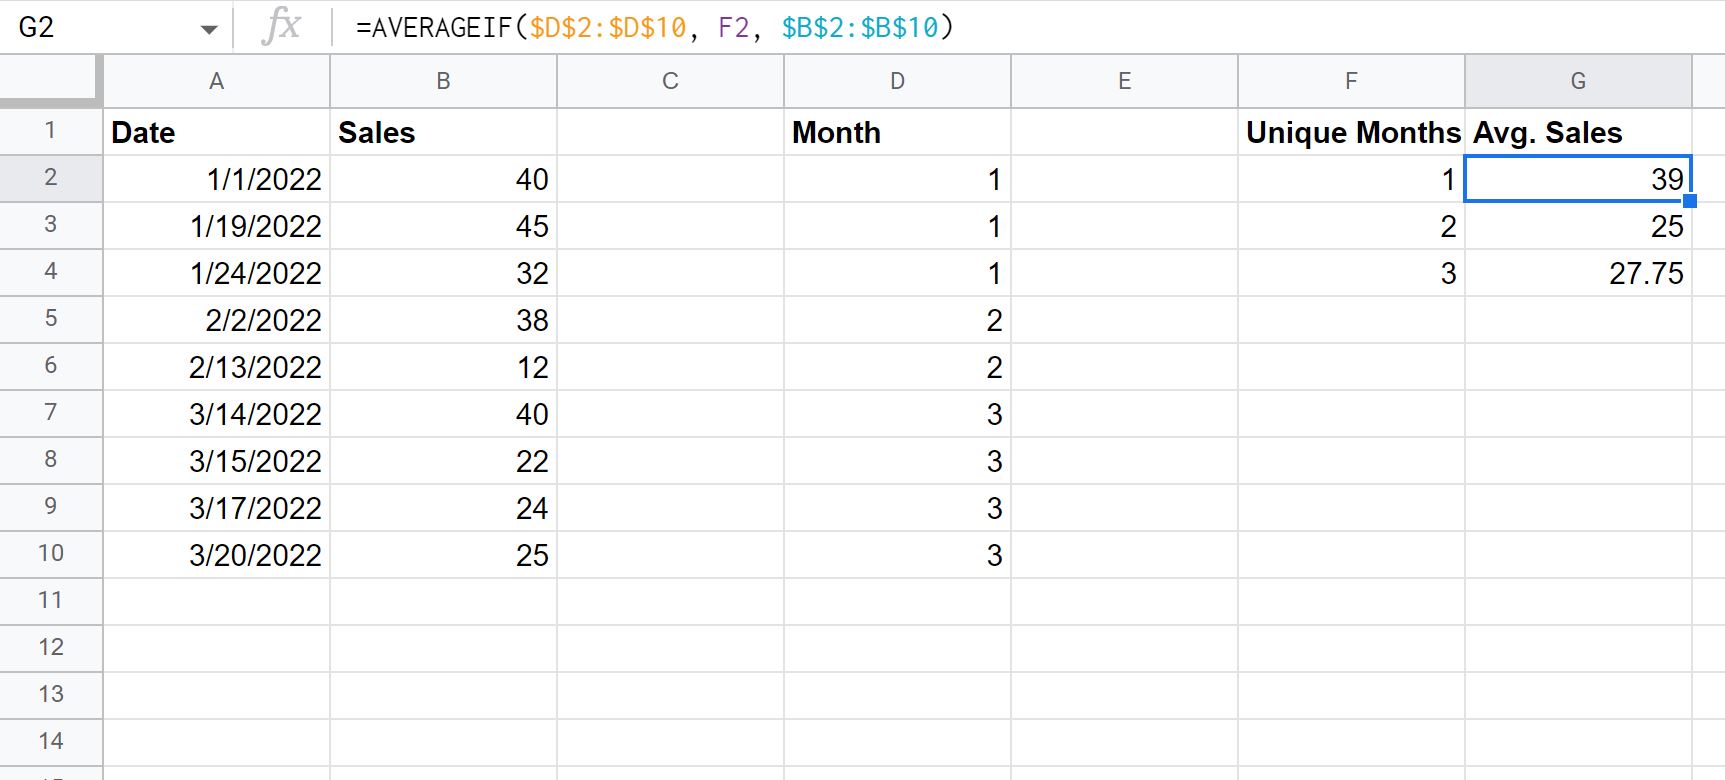
This tells us:
- The average daily sales value in January was 39.
- The average daily sales value in February was 25.
- The average daily sales value in March was 27.75.
Additional Resources
The following tutorials explain how to perform other common tasks in Google Sheets:
How to Use AVERAGEIFS in Google Sheets
How to Average Filtered Rows in Google Sheets
How to Calculate Average If Not Blank in Google Sheets