Linear regression is a method that can be used to quantify the relationship between one or more explanatory variables and a response variable.
We use simple linear regression when there is only one explanatory variable and multiple linear regression when there are two or more explanatory variables.
It’s possible to perform both types of regressions using the LINEST() function in Google Sheets, which uses the following syntax:
LINEST(known_data_y, known_data_x, calculate_b, verbose)
where:
- known_data_y: Array of response values
- known_data_x: Array of explanatory values
- calculate_b: Indicates whether or not to calculate the y-intercept. This is TRUE by default and we leave it this way for linear regression.
- verbose: Indicates whether or not to provide additional regression statistics beyond just the slope and intercept. This is FALSE by default, but we will specify this to be TRUE in our examples.
The following examples show how to use this function in practice.
Simple Linear Regression in Google Sheets
Suppose we are interested in understanding the relationship between hours studied and exam score. studies for an exam and the exam score they receive.
To explore this relationship, we can perform simple linear regression using hours studied as an explanatory variable and exam score as a response variable.
The following screenshot shows how to perform simple linear regression using a dataset of 20 students with the following formula used in cell D2:
=LINEST(B2:B21, A2:A21, TRUE, TRUE)

The following screenshot provide annotations for the output:
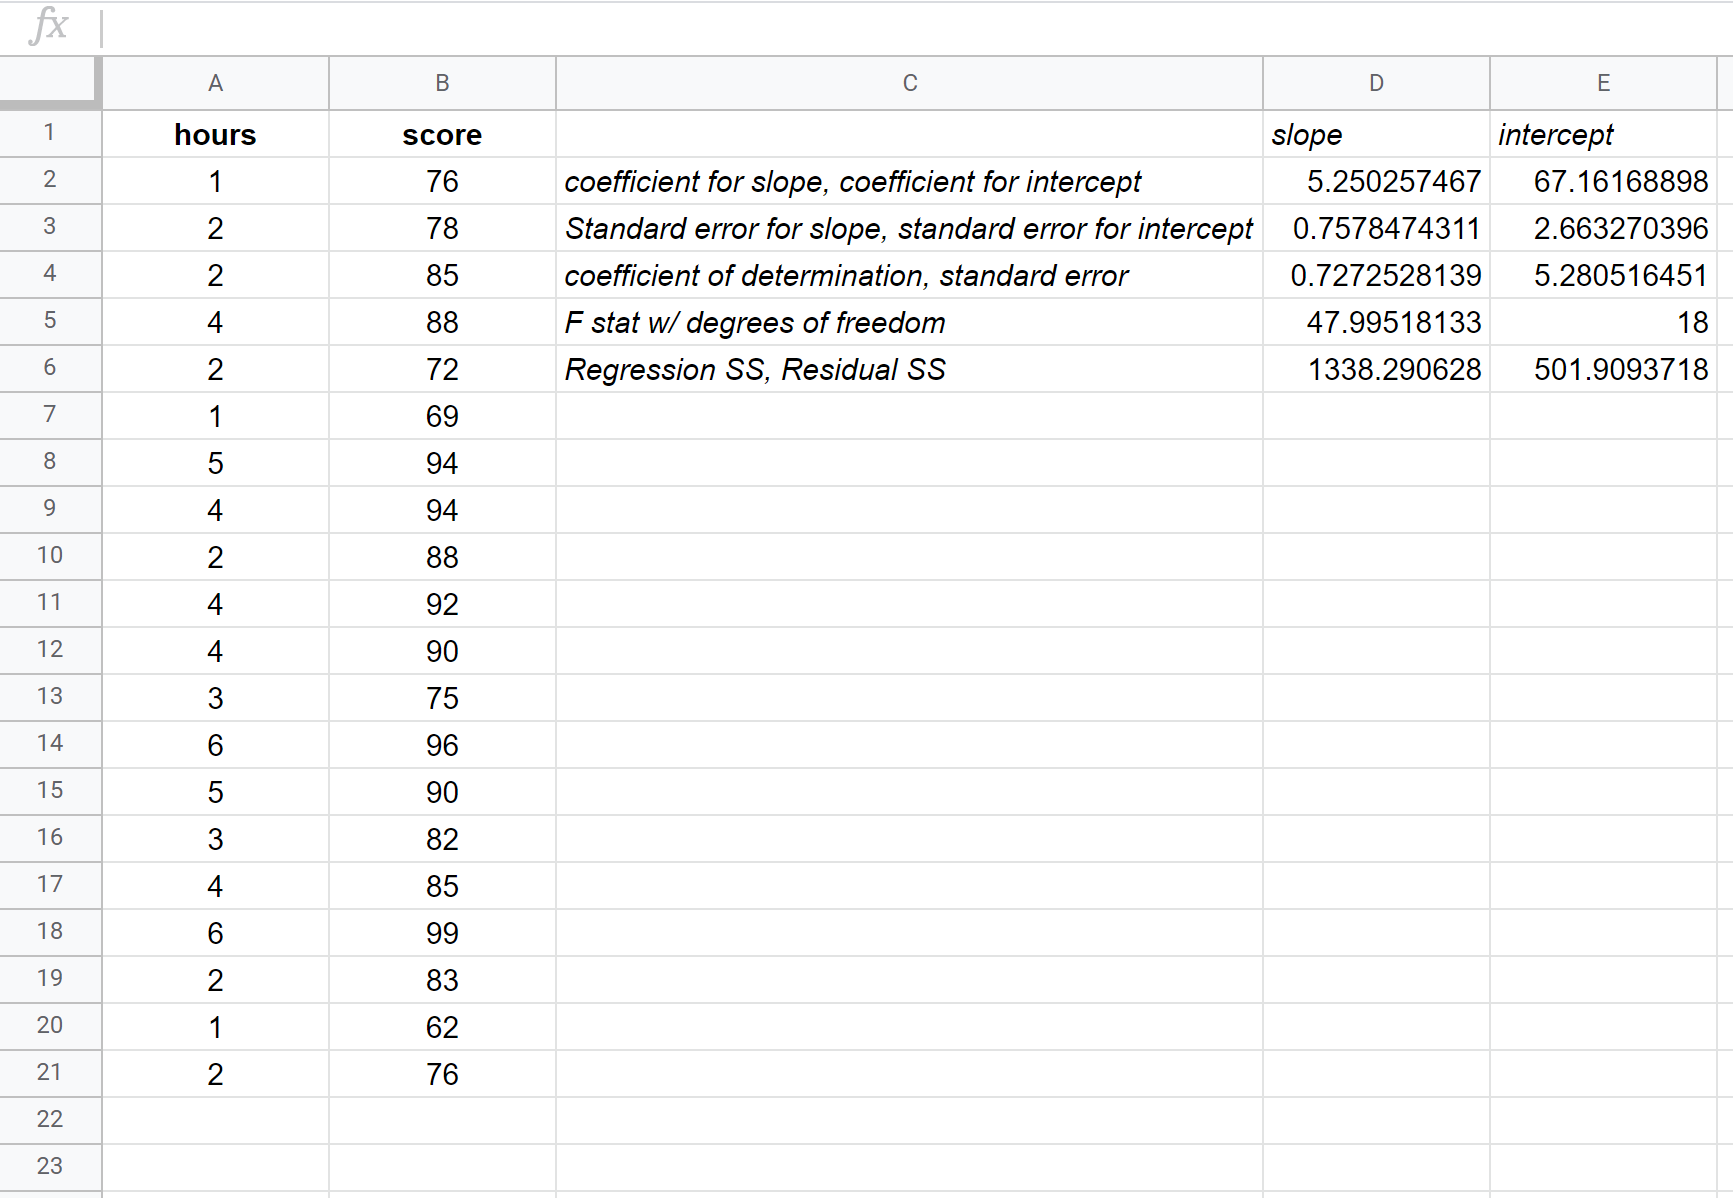
Here is how to interpret the most relevant numbers in the output:
R Square: 0.72725. This is known as the coefficient of determination. It is the proportion of the variance in the response variable that can be explained by the explanatory variable. In this example, roughly 72.73% of the variation in the exam scores can be explained by the number of hours studied.
Standard error: 5.2805. This is the average distance that the observed values fall from the regression line. In this example, the observed values fall an average of 5.2805 units from the regression line.
Coefficients: The coefficients give us the numbers necessary to write the estimated regression equation. In this example the estimated regression equation is:
Exam score = 67.16 + 5.2503*(hours)
We interpret the coefficient for hours to mean that for each additional hour studied, the exam score is expected to increase by 5.2503, on average. We interpret the coefficient for the intercept to mean that the expected exam score for a student who studies zero hours is 67.16.
We can use this estimated regression equation to calculate the expected exam score for a student, based on the number of hours they study. For example, a student who studies for three hours is expected to receive an exam score of 82.91:
Exam score = 67.16 + 5.2503*(3) = 82.91
Multiple Linear Regression in Google Sheets
Suppose we want to know if the number of hours spent studying and the number of prep exams taken affects the score that a student receives on a certain college entrance exam.
To explore this relationship, we can perform multiple linear regression using hours studied and prep exams taken as explanatory variables and exam score as a response variable.
The following screenshot shows how to perform multiple linear regression using a dataset of 20 students with the following formula used in cell E2:
=LINEST(C2:C21, A2:B21, TRUE, TRUE)
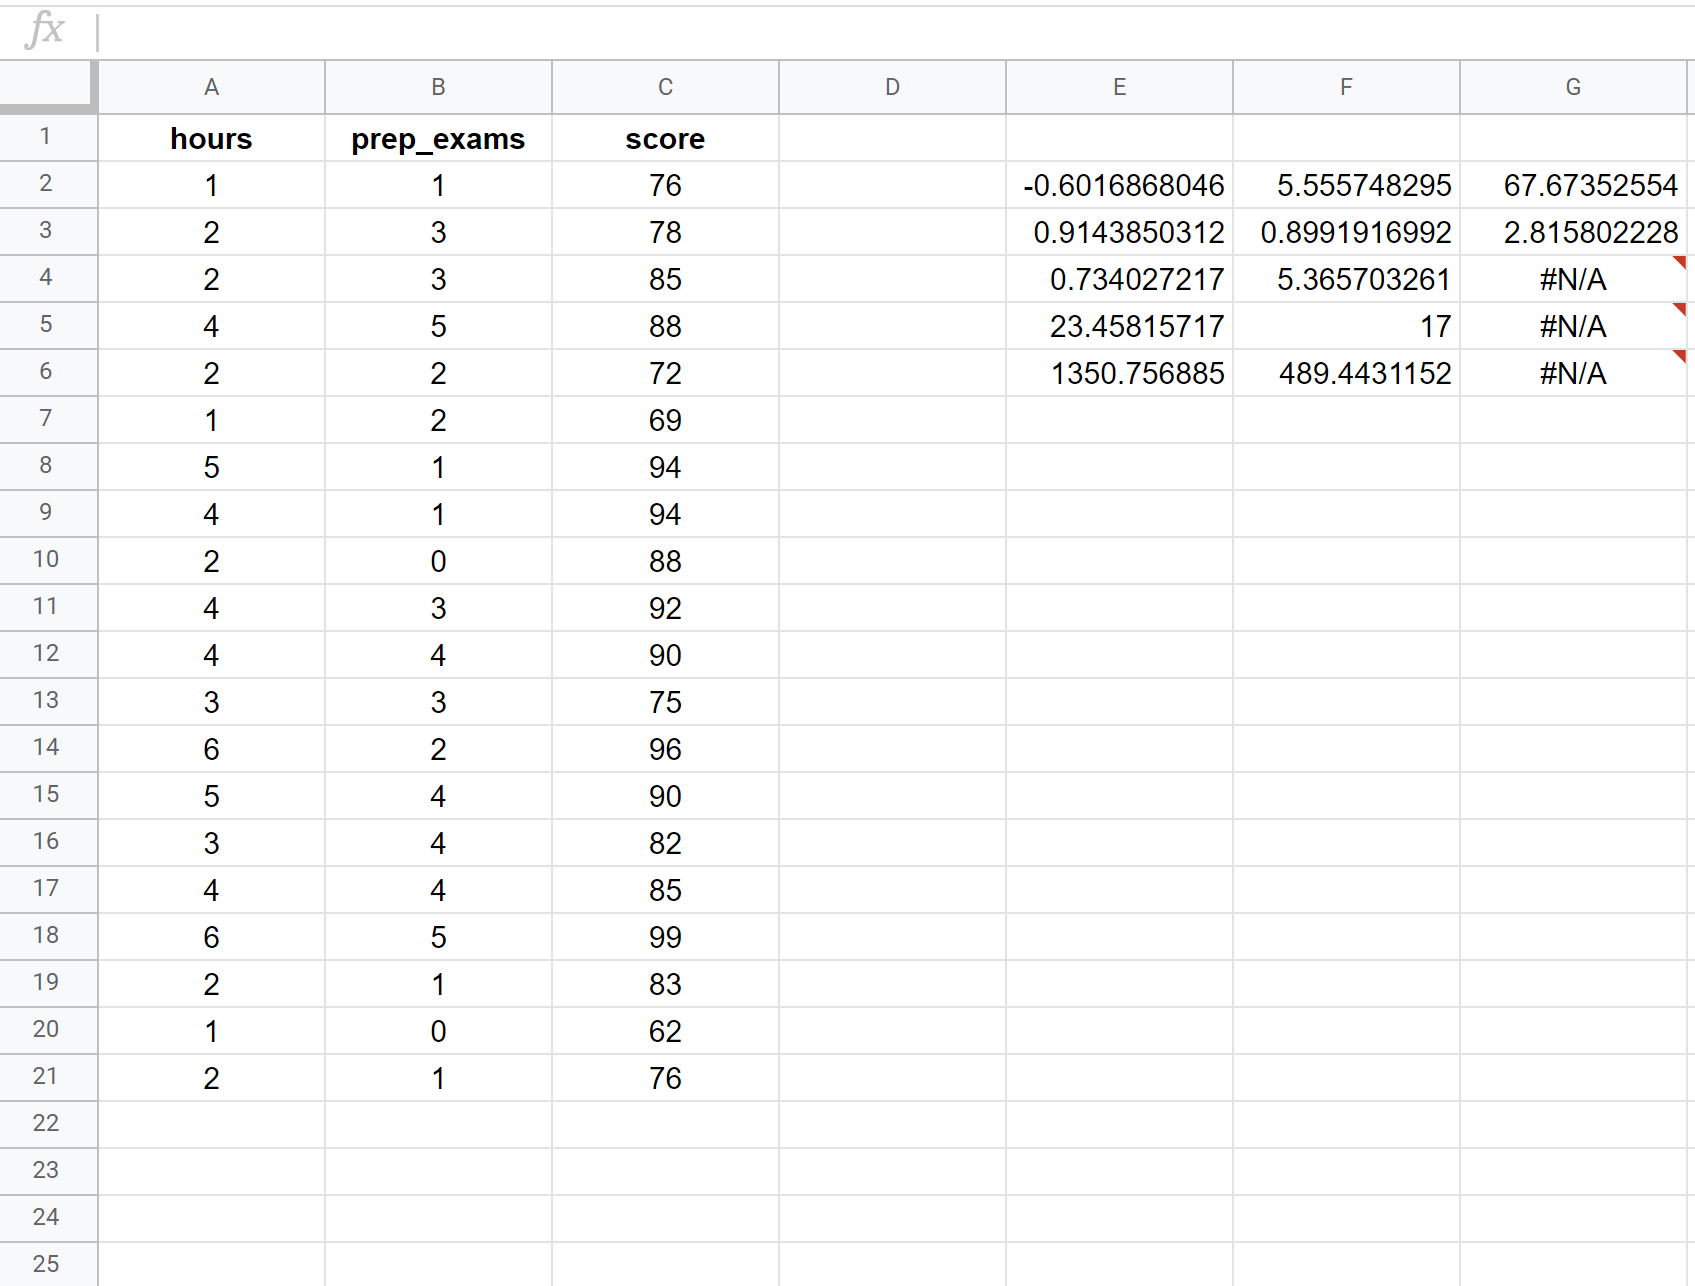
Here is how to interpret the most relevant numbers in the output:
R Square: 0.734. This is known as the coefficient of determination. It is the proportion of the variance in the response variable that can be explained by the explanatory variables. In this example, 73.4% of the variation in the exam scores can be explained by the number of hours studied and the number of prep exams taken.
Standard error: 5.3657. This is the average distance that the observed values fall from the regression line. In this example, the observed values fall an average of 5.3657 units from the regression line.
Estimated regression equation: We can use the coefficients from the output of the model to create the following estimated regression equation:
Exam score = 67.67 + 5.56*(hours) – 0.60*(prep exams)
We can use this estimated regression equation to calculate the expected exam score for a student, based on the number of hours they study and the number of prep exams they take. For example, a student who studies for three hours and takes one prep exam is expected to receive a score of 83.75:
Exam score = 67.67 + 5.56*(3) – 0.60*(1) = 83.75
Additional Resources
The following tutorials explain how to perform other common tasks in Google Sheets:
How to Perform Polynomial Regression in Google Sheets
How to Create a Residual Plot in Google Sheets