87
You can use the following syntax to create boxplots by group in Matplotlib:
import matplotlib as plt
import seaborn as sns

sns.boxplot(x='group', y='values', data=df)
The following examples show how to use this syntax to create boxplots by group for datasets in both long-form and wide-form.
Example 1: Boxplots by Group for Long-Form Data
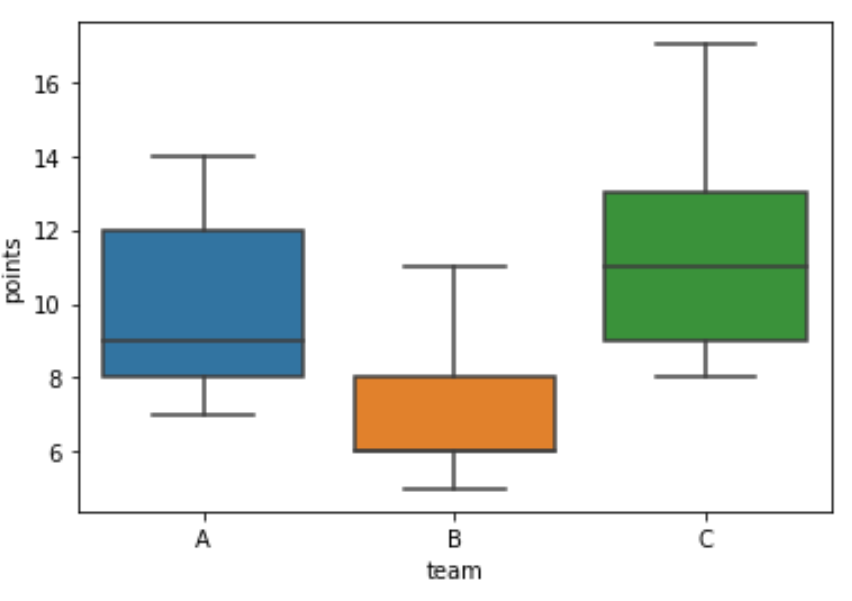
The following code shows how to create boxplots by group for a pandas DataFrame in a long format:
import pandas as pd
import numpy as np
import matplotlib as plt
import seaborn as sns

#create long-form data
df = pd.DataFrame({'points': [7, 8, 9, 12, 14, 5, 6, 6, 8, 11, 8, 9, 11, 13, 17],
                   'team': np.repeat(['A', 'B', 'C'], 5)})

#view data
print(df)

    points team
0        7    A
1        8    A
2        9    A
3       12    A
4       14    A
5        5    B
6        6    B
7        6    B
8        8    B
9       11    B
10       8    C
11       9    C
12      11    C
13      13    C
14      17    C

#create boxplot by group
sns.boxplot(x='team', y='points', data=df)
Example 2: Boxplots by Group for Wide-Form Data
The following code shows how to create boxplots by group for a pandas DataFrame in a wide format:
import pandas as pd
import numpy as np
import matplotlib as plt
import seaborn as sns

#create wide-form data
df = pd.DataFrame({'A': [7, 8, 9, 12, 14],
                   'B': [5, 6, 6, 8, 11],
                   'C': [8, 9, 11, 13, 17]})

#view data
print(df)

    A   B   C
0   7   5   8
1   8   6   9
2   9   6  11
3  12   8  13
4  14  11  17

#create boxplot by group
sns.boxplot(x='variable', y='value', data=pd.melt(df)).set(
            xlabel='team',
            ylabel='points')
Additional Resources
How to Plot Multiple Lines in Matplotlib
How to Create Stacked Bar Charts in Matplotlib