You can use the logx and logy arguments to create histograms with log scales on the x-axis and y-axis, respectively, in pandas:
#create histogram with log scale on x-axis
df['my_column'].plot(kind='hist', logx=True)

#create histogram with log scale on y-axis
df['my_column'].plot(kind='hist', logy=True)
The following example shows how to use these arguments to create histograms with log scales in pandas.
Related: When Should You Use a Log Scale in Charts?
Example: Create Histogram with Log Scale in Pandas
Suppose we have the following pandas DataFrame with 5,000 rows:
import pandas as pd
import numpy as np

#make this example reproducible
np.random.seed(1)

#create DataFrame
df = pd.DataFrame({'values': np.random.lognormal(size=5000)})

#view first five rows of DataFrame
print(df.head())

     values
0  5.075096
1  0.542397
2  0.589682
3  0.341992
4  2.375974
We can use the following syntax to create a histogram with a linear scale on both the x-axis and y-axis:
#create histogram
df['values'].plot(kind='hist')

The x-axis and y-axis both currently have a linear scale.
We can use the logx=True argument to convert the x-axis to a log scale:
#create histogram with log scale on x-axis
df['values'].plot(kind='hist', logx=True)
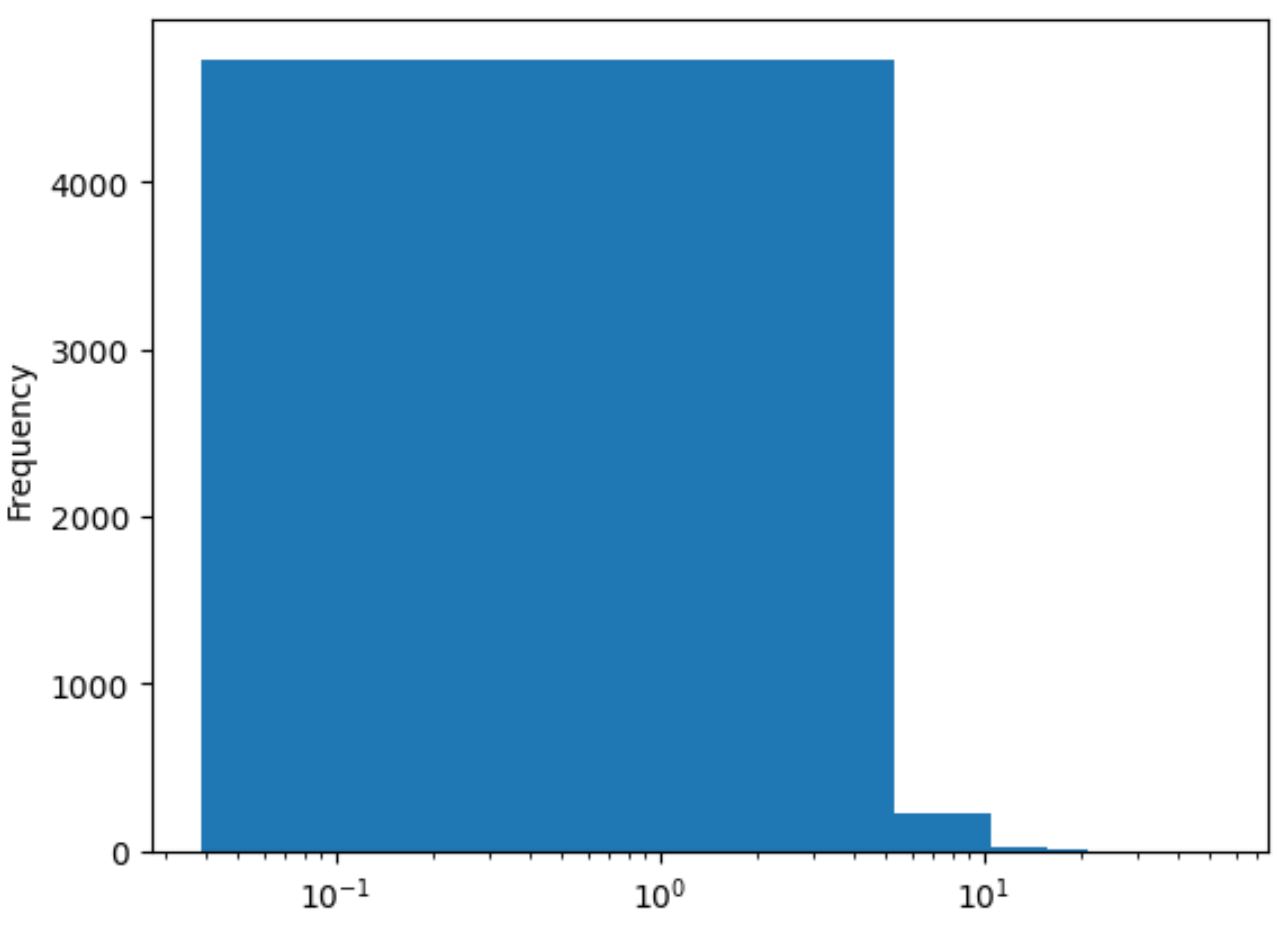
The values on the x-axis now follow a log scale.
And we can use the logy=True argument to convert the y-axis to a log scale:
#create histogram with log scale on y-axis
df['values'].plot(kind='hist', logy=True) 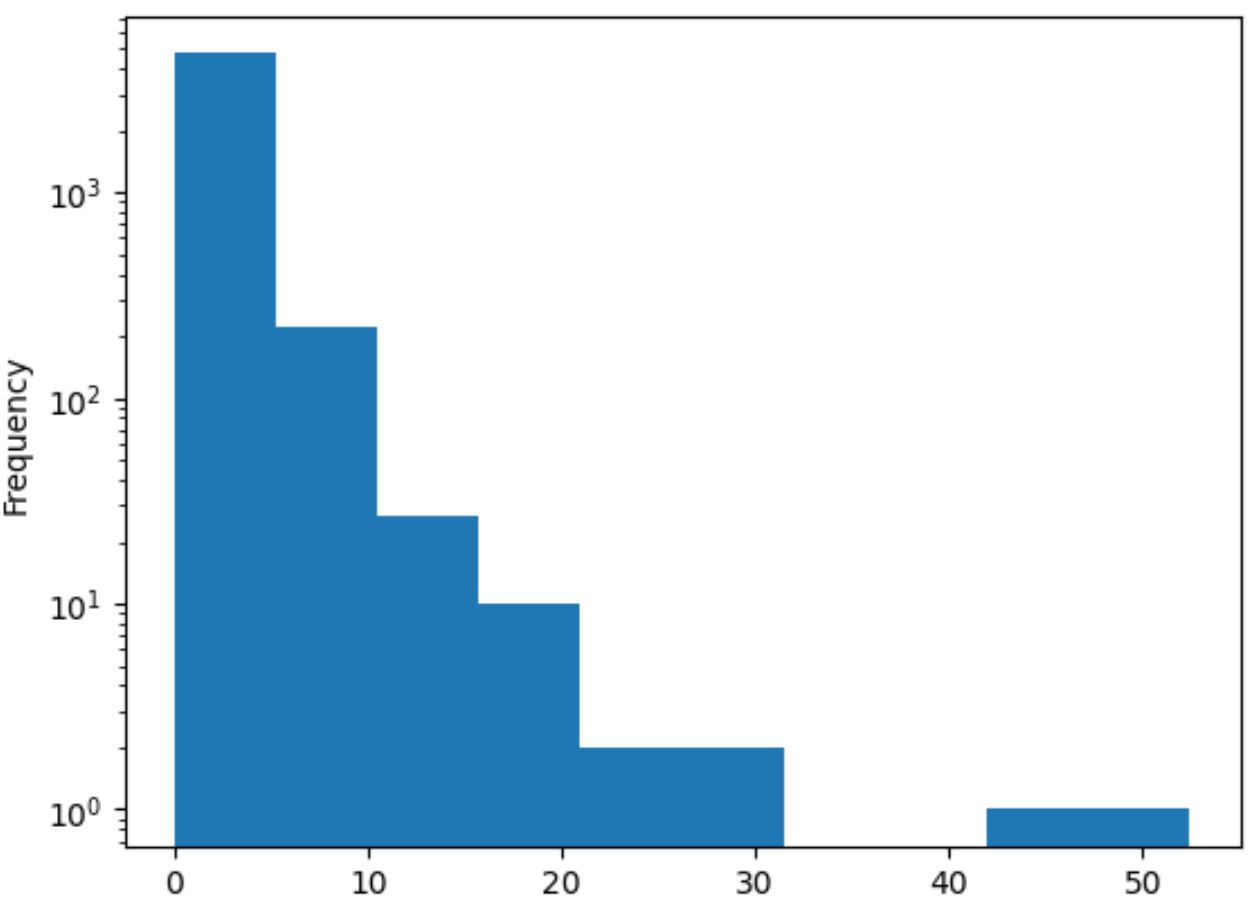
The values on the y-axis now follow a log scale.
Additional Resources
The following tutorials explain how to perform other common tasks in pandas:
How to Create a Histogram from Pandas DataFrame
How to Create a Histogram from a Pandas Series
How to Plot Histograms by Group in Pandas