You can use the following methods to plot the results of the lm() function in R:
Method 1: Plot lm() Results in Base R
#create scatterplot
plot(y ~ x, data=data)

#add fitted regression line to scatterplot
abline(fit)
Method 2: Plot lm() Results in ggplot2
library(ggplot2)

#create scatterplot with fitted regression line
ggplot(data, aes(x = x, y = y)) +
  geom_point() +
  stat_smooth(method = "lm")
The following examples shows how to use each method in practice with the built-in mtcars dataset in R.
Example 1: Plot lm() Results in Base R
The following code shows how to plot the results of the lm() function in base R:
#fit regression model
fit #create scatterplot
plot(mpg ~ wt, data=mtcars)

#add fitted regression line to scatterplot
abline(fit) 
The points in the plot represent the raw data values and the straight diagonal line represents the fitted regression line.
Example 2: Plot lm() Results in ggplot2
The following code shows how to plot the results of the lm() function using the ggplot2 data visualization package:
library(ggplot2)

#fit regression model
fit #create scatterplot with fitted regression line
ggplot(mtcars, aes(x = x, y = y)) +
  geom_point() +
  stat_smooth(method = "lm")

The blue line represents the fitted regression line and the grey bands represent the 95% confidence interval limits.
To remove the confidence interval limits, simply use se=FALSE in the stat_smooth() argument:
library(ggplot2)

#fit regression model
fit #create scatterplot with fitted regression line
ggplot(mtcars, aes(x = x, y = y)) +
  geom_point() +
stat_smooth(method = "lm", se=FALSE) 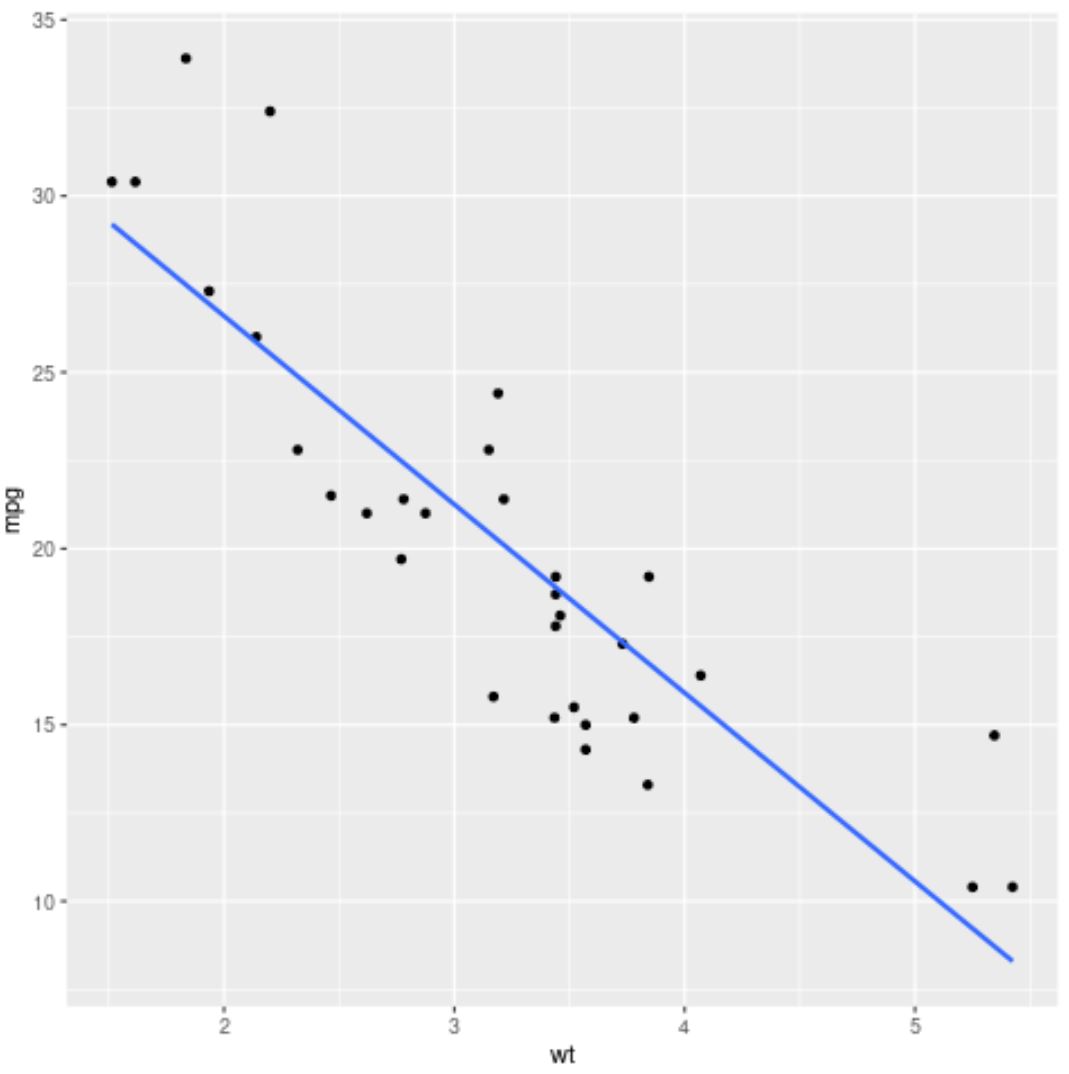
You can also add the fitted regression equation inside the chart by using the stat_regline_equation() function from the ggpubr package:
library(ggplot2)
library(ggpubr)

#fit regression model
fit #create scatterplot with fitted regression line
ggplot(mtcars, aes(x = x, y = y)) +
  geom_point() +
  stat_smooth(method = "lm", se=FALSE) +
stat_regline_equation(label.x.npc = "center") 
Additional Resources
The following tutorials explain how to perform other common tasks in R:
How to Perform Simple Linear Regression in R
How to Interpret Regression Output in R
The Difference Between glm and lm in R