A stem-and-leaf plot is a chart we can use to display data by splitting up each value in a dataset into a stem and a leaf.
Here is an example of a stem-and-leaf plot for a given dataset, created by the Statology Stem-and-Leaf Plot Generator:

The stem for each value is simply the first digit of the value while the leaf is the second digit of the value.
Now let’s find out how to create a stem-and-leaf plot in Excel.
Example: Stem-and-Leaf Plot in Excel
Use the following steps to create a stem-and-leaf plot in Excel.
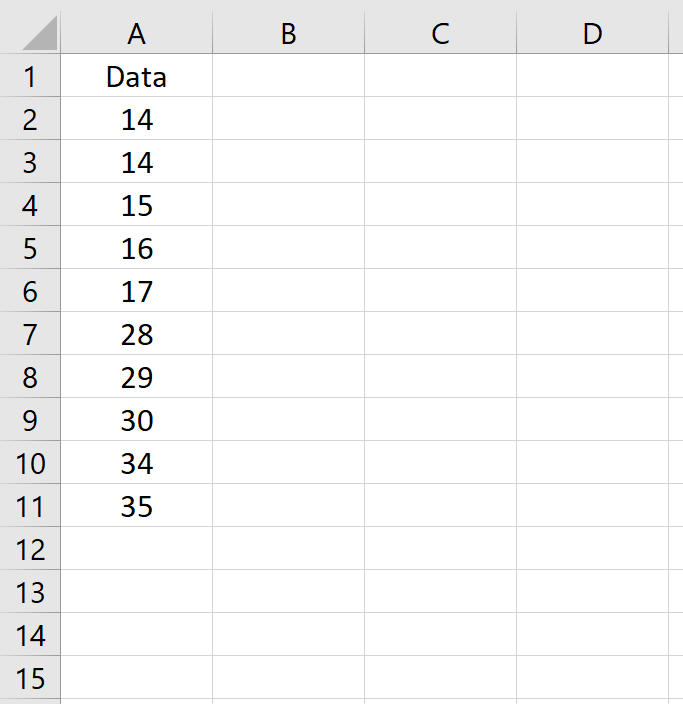
Step 1: Enter the data.
Enter the data values in a single column:
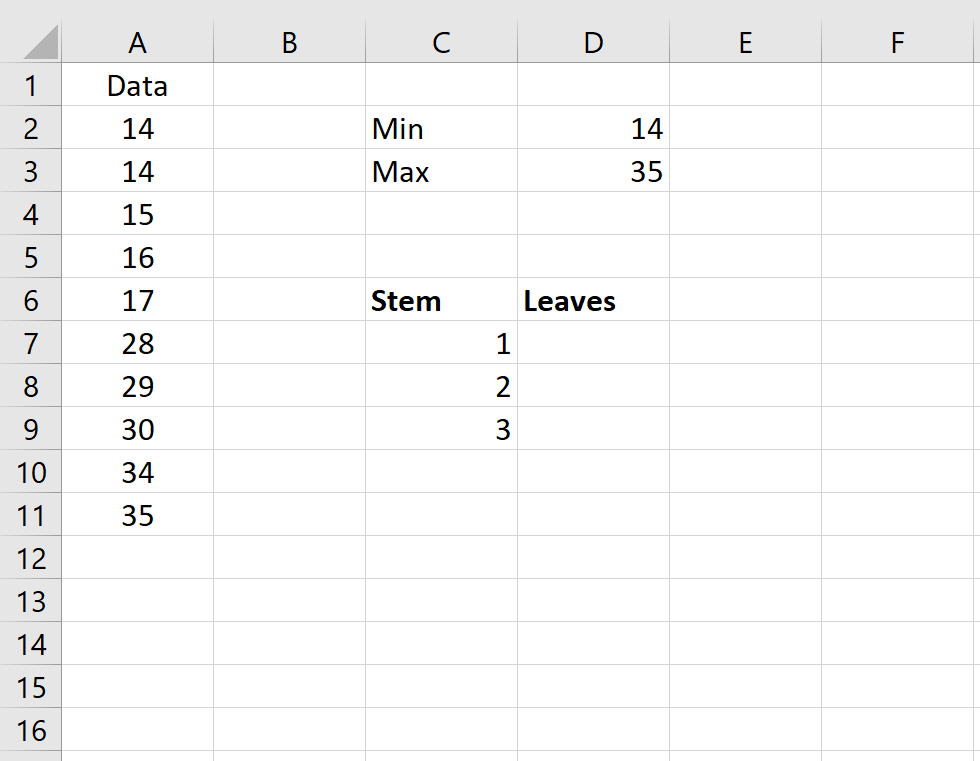
Step 2: Identify the minimum and maximum values.

Step 3: Manually enter the “stems” based on the minimum and maximum values.
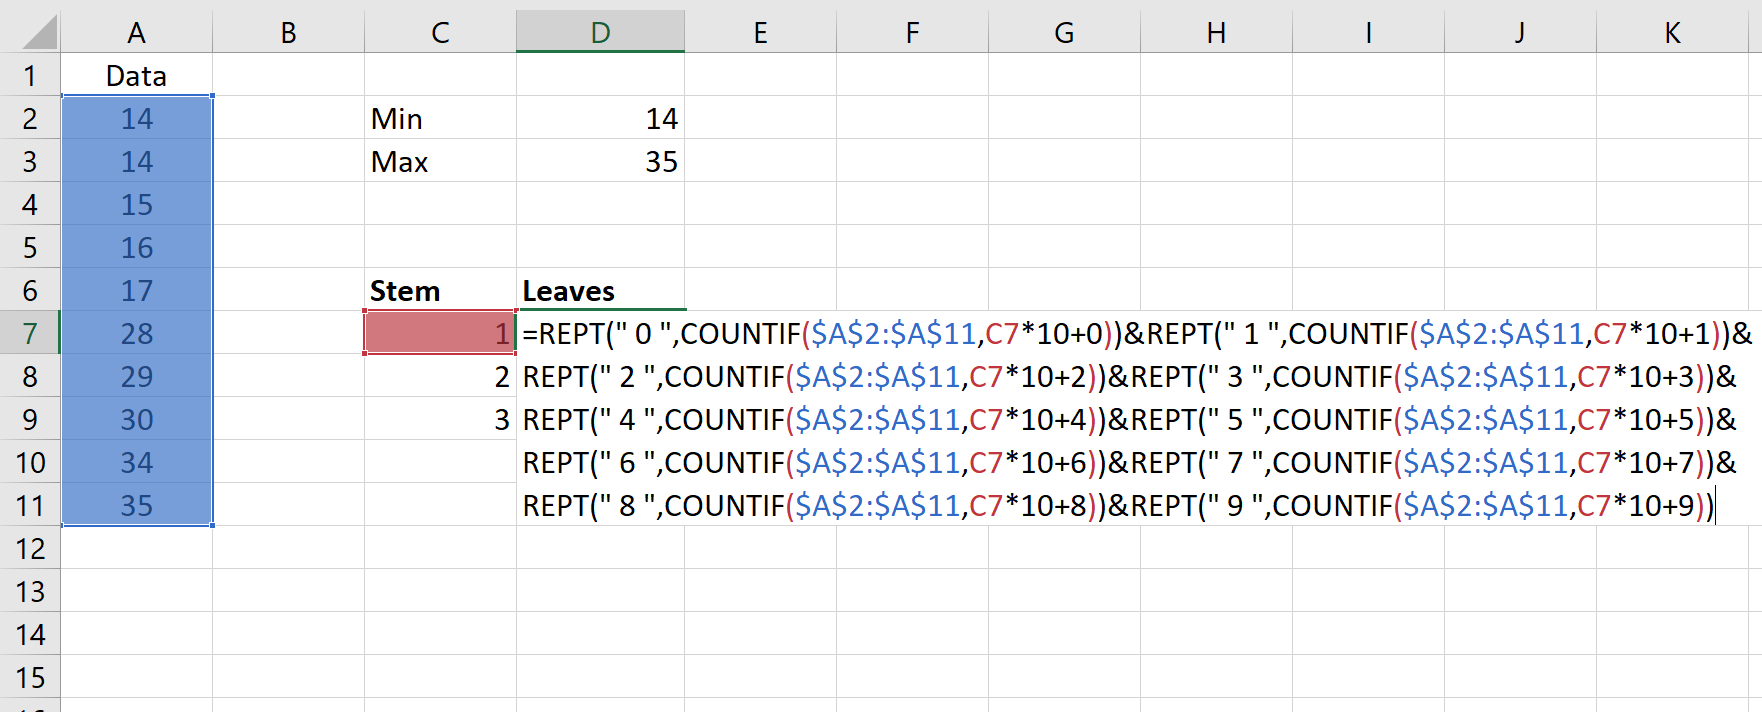
Step 4: Calculate the “leaves” for the first row.
The following calculation shows how to compute the leaves for the first row. Don’t be intimidated by the length of the formula – it’s actually very simple, just repetitive.
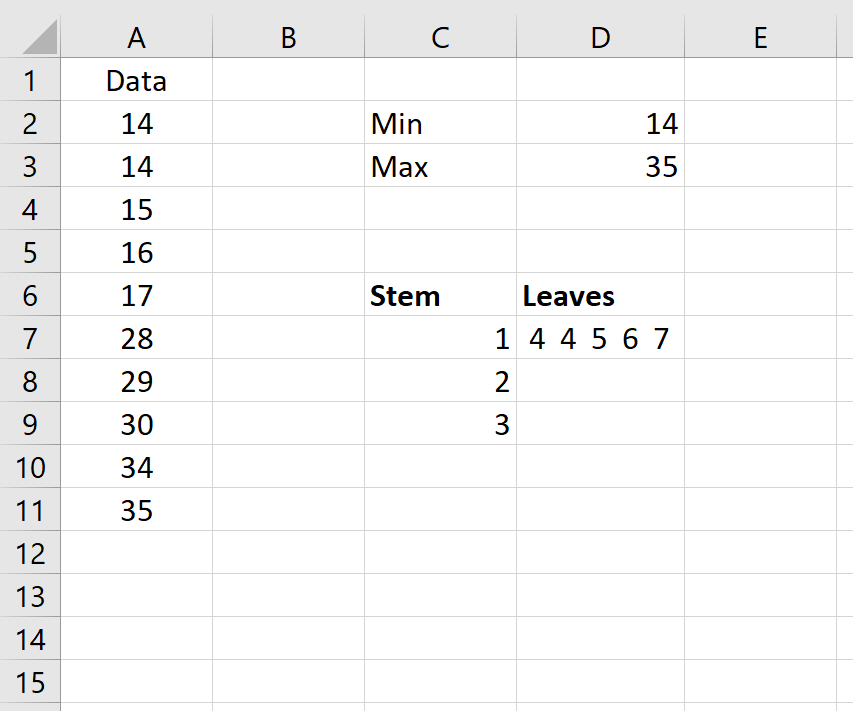
Once you finish typing the formula and click Enter, you will get the following result:
Step 5: Repeat the calculation for each row.
To repeat this calculation for each row, simply click on cell D7, hover over the bottom-right hand corner of the cell until a tiny + appears, then double-click. This will copy the formula to the rest of the rows in the Stem-and-Leaf plot:
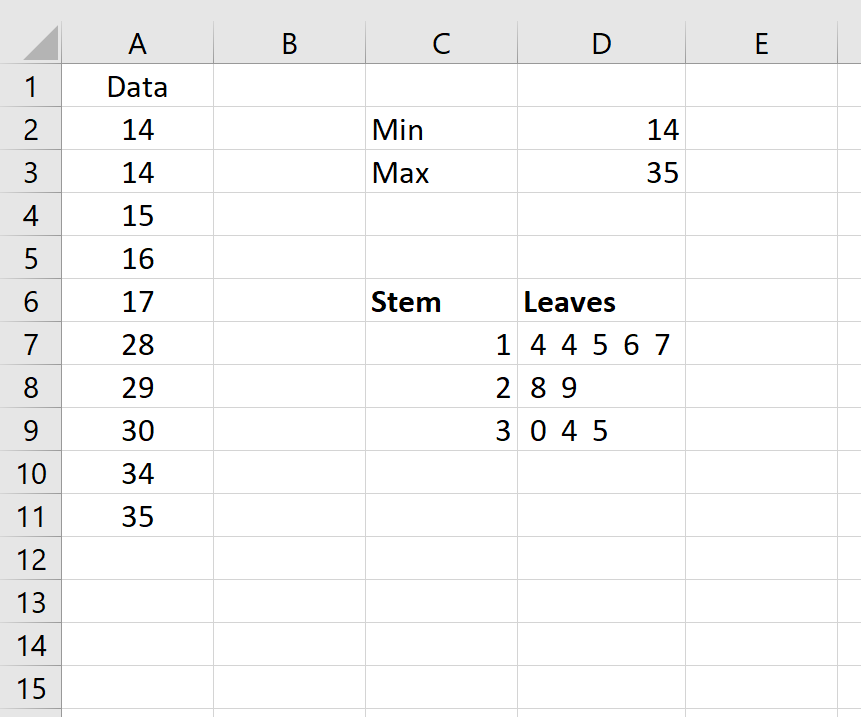
To double check that your results are correct, you can verify three numbers:
- Make sure the number of individual “leaves” matches the number of observations. In our example, we have 10 total “leaves” which matches the 10 observations in our original dataset.
- Verify the minimum number. The very first leaf should match the minimum value in your dataset. In our example, we see that the first leaf is “4” and is paired with a stem of “1” which matches the minimum number of “14” in our dataset.
- Verify the maximum number. The very last leaf should match the maximum value in your dataset. In our example, we see that the last leaf is “5” and is paired with a stem of “3” which matches the minimum number of “35” in our dataset.
Once you verify these three numbers, you can be confident that your Stem-and-Leaf plot is correct.
Additional Resources
An Introduction to Stem-and-Leaf Plots
An Introduction to Back to Back Stem-and-Leaf Plots