This tutorial provides a step-by-step example of how to change the x-axis and y-axis scales on plots in Excel.
Step 1: Enter the Data
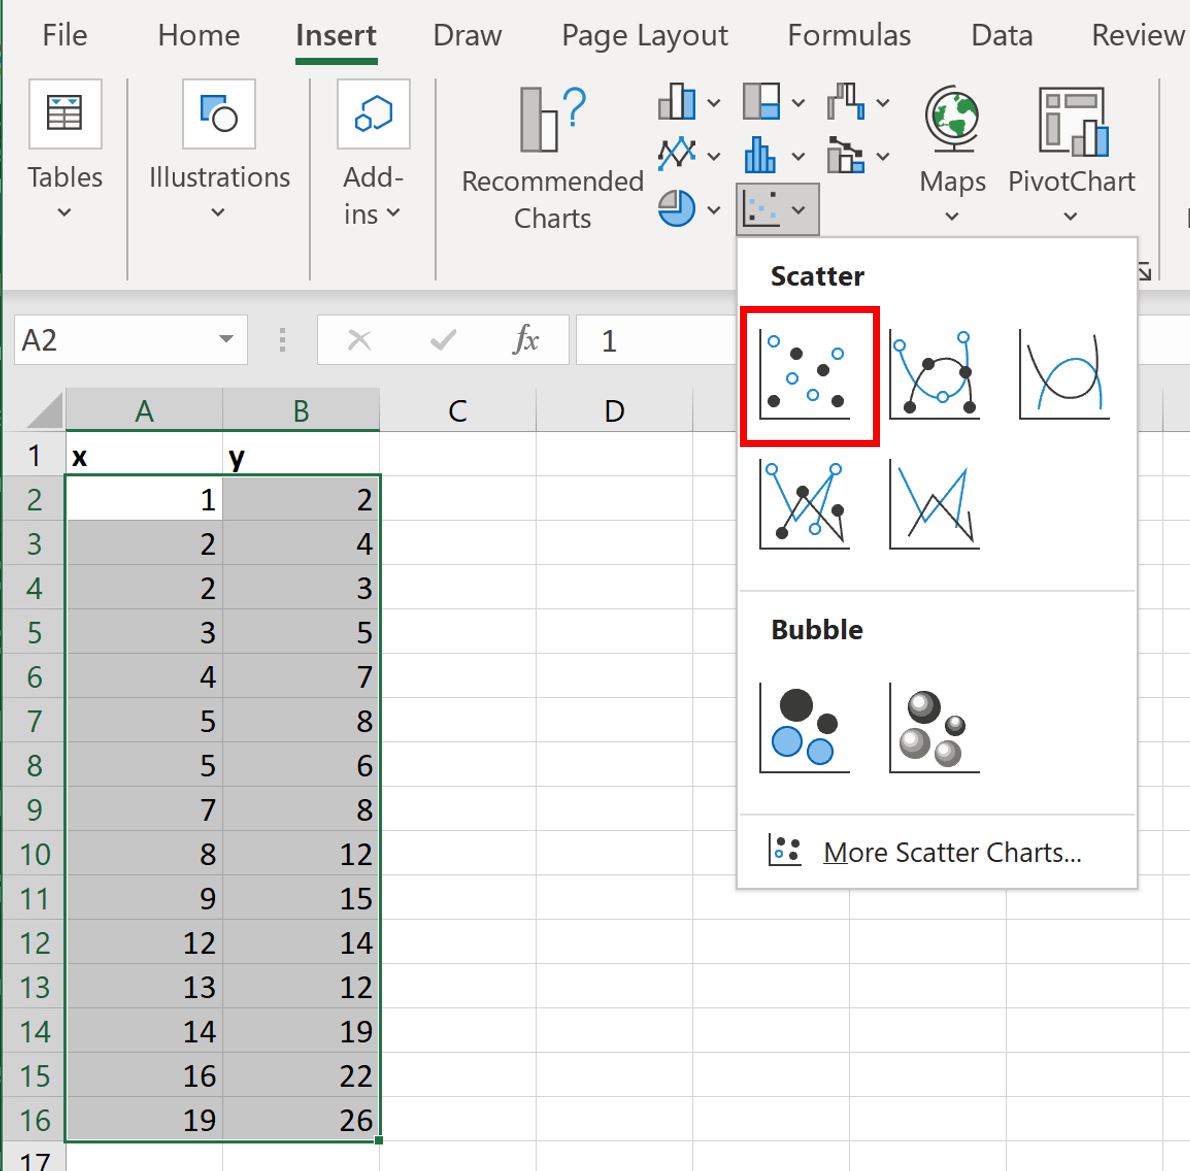
First, let’s enter a simple dataset into Excel:

Step 2: Create a Scatterplot
Next, highlight the cells in the range A2:B16. Then click the Insert tab along the top ribbon and then click the Scatter option within the Charts group:
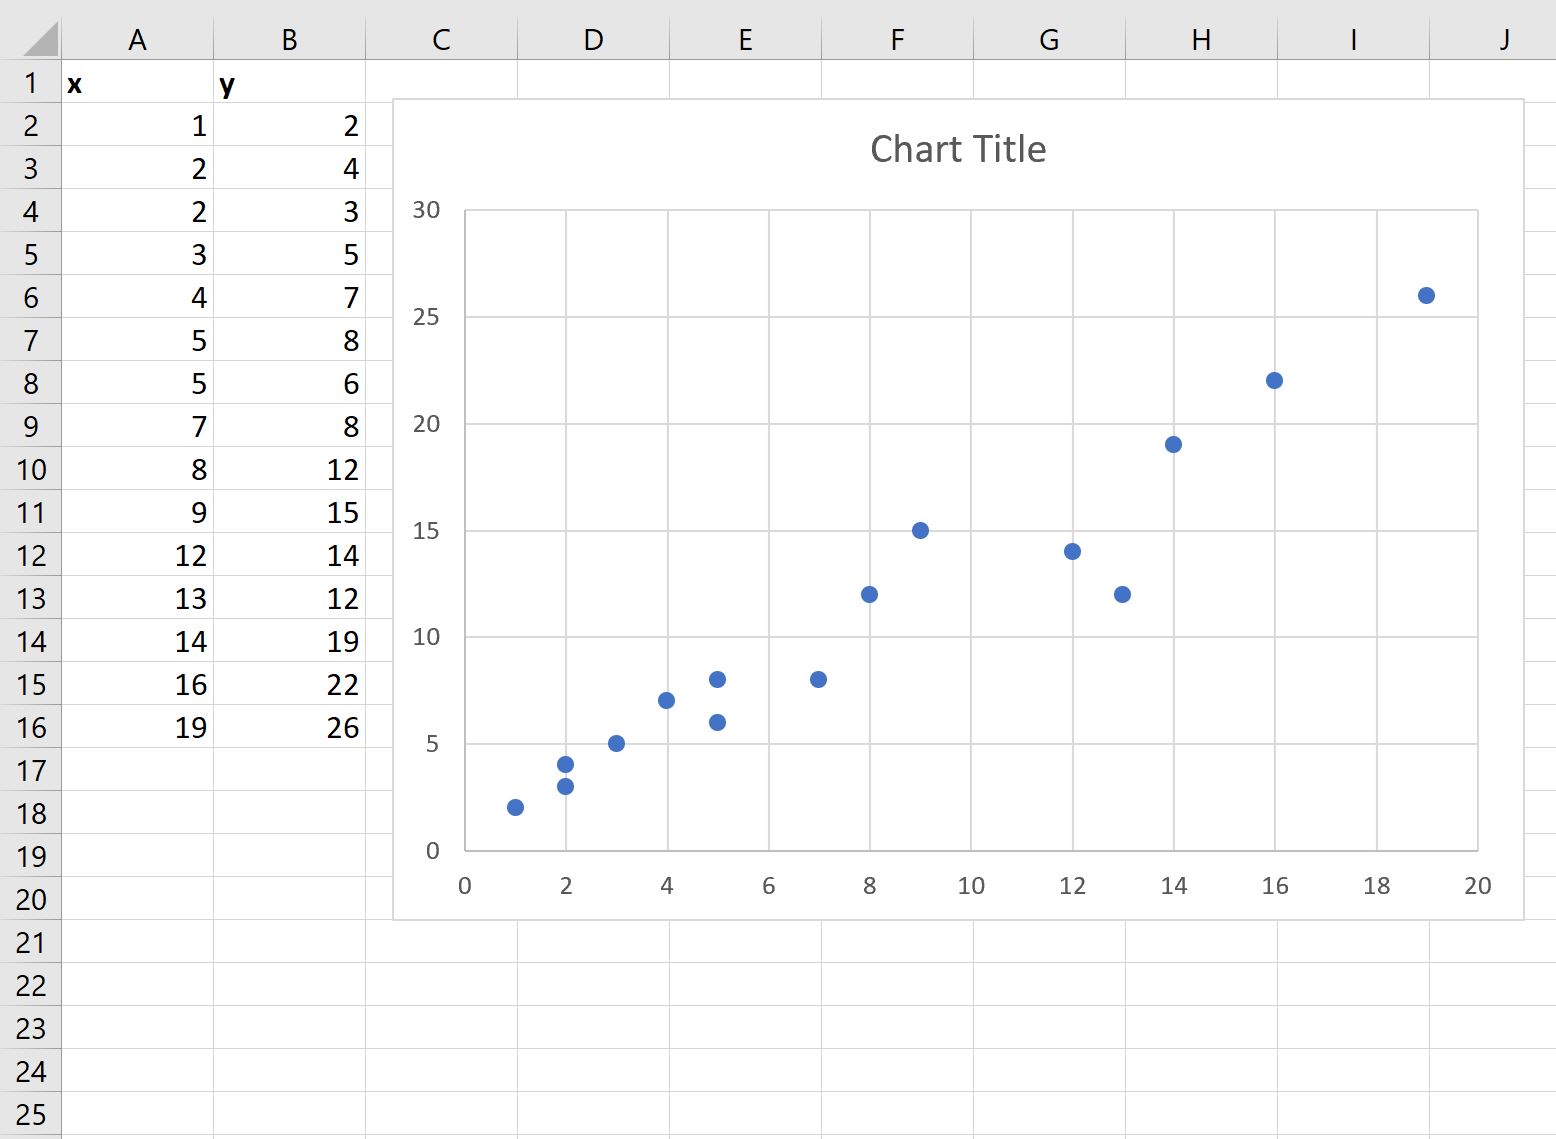
The following scatterplot will automatically be created:
Step 3: Change the Axis Scales
By default, Excel will choose a scale for the x-axis and y-axis that ranges roughly from the minimum to maximum values in each column.
In this example, we can see that the x-axis ranges from 0 to 20 and the y-axis ranges from 0 to 30.
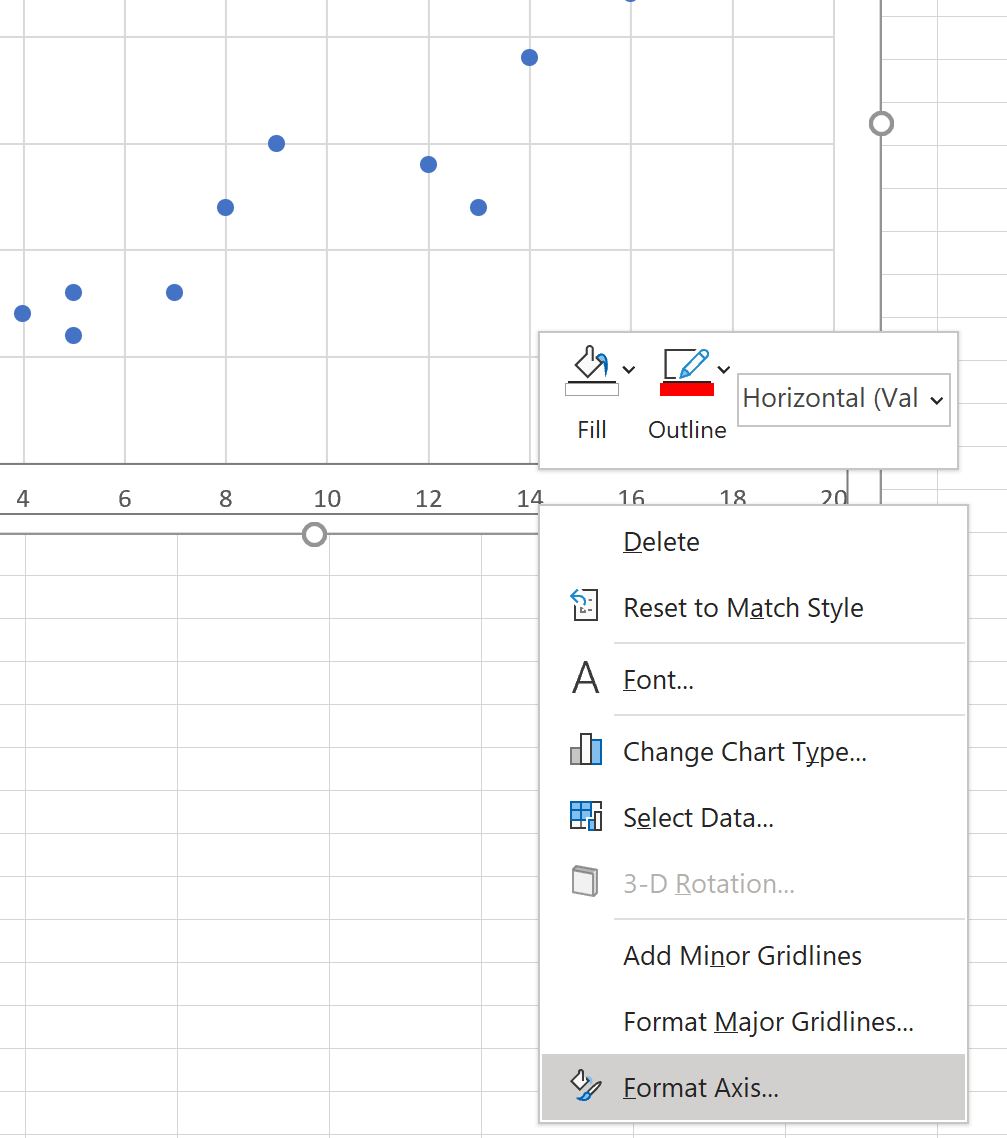
To change the scale of the x-axis, simply right click on any of the values on the x-axis. In the dropdown menu that appears, click Format Axis:
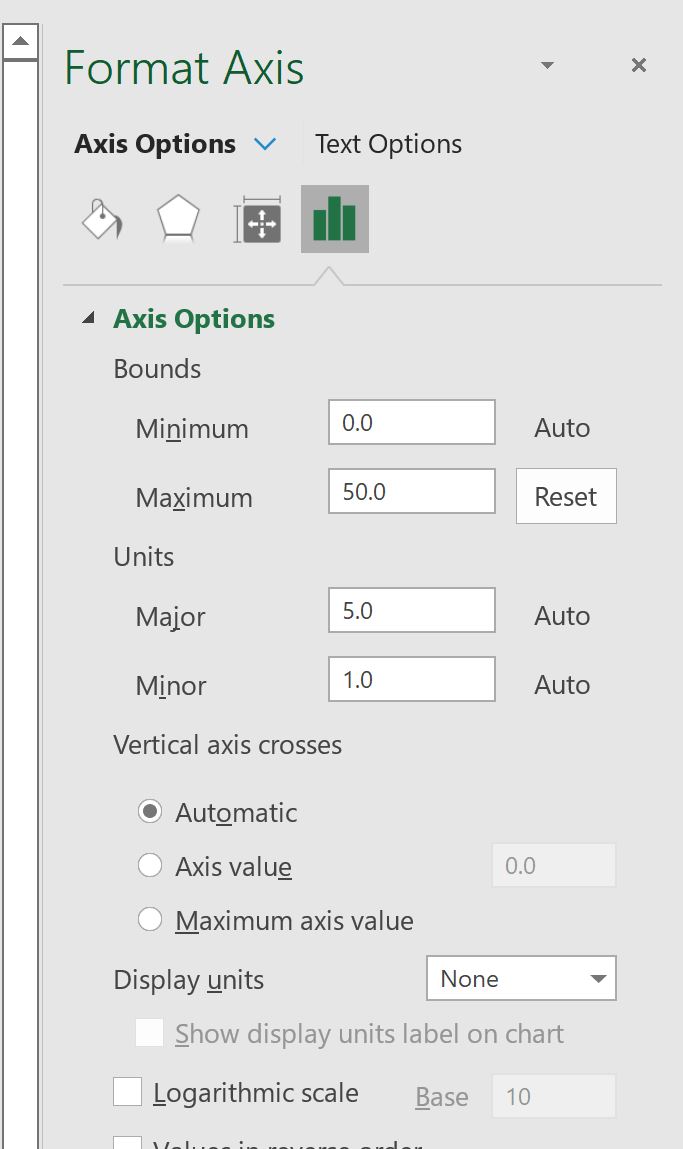
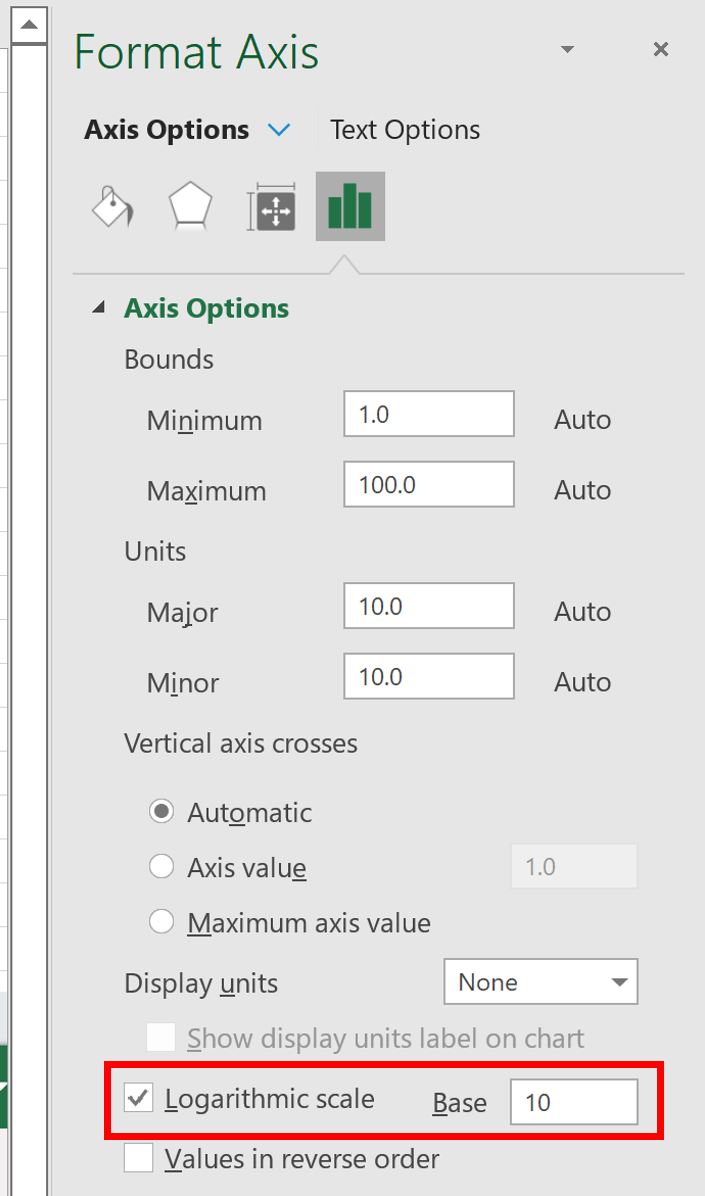
In the Format Axis panel that appears on the right side of the screen, change the values in the Minimum and Maximum boxes to change the scale of the x-axis.
For example, we could change the Maximum value of the x-axis to 50:
Once we press Enter, the x-axis scale will automatically be updated on the plot:
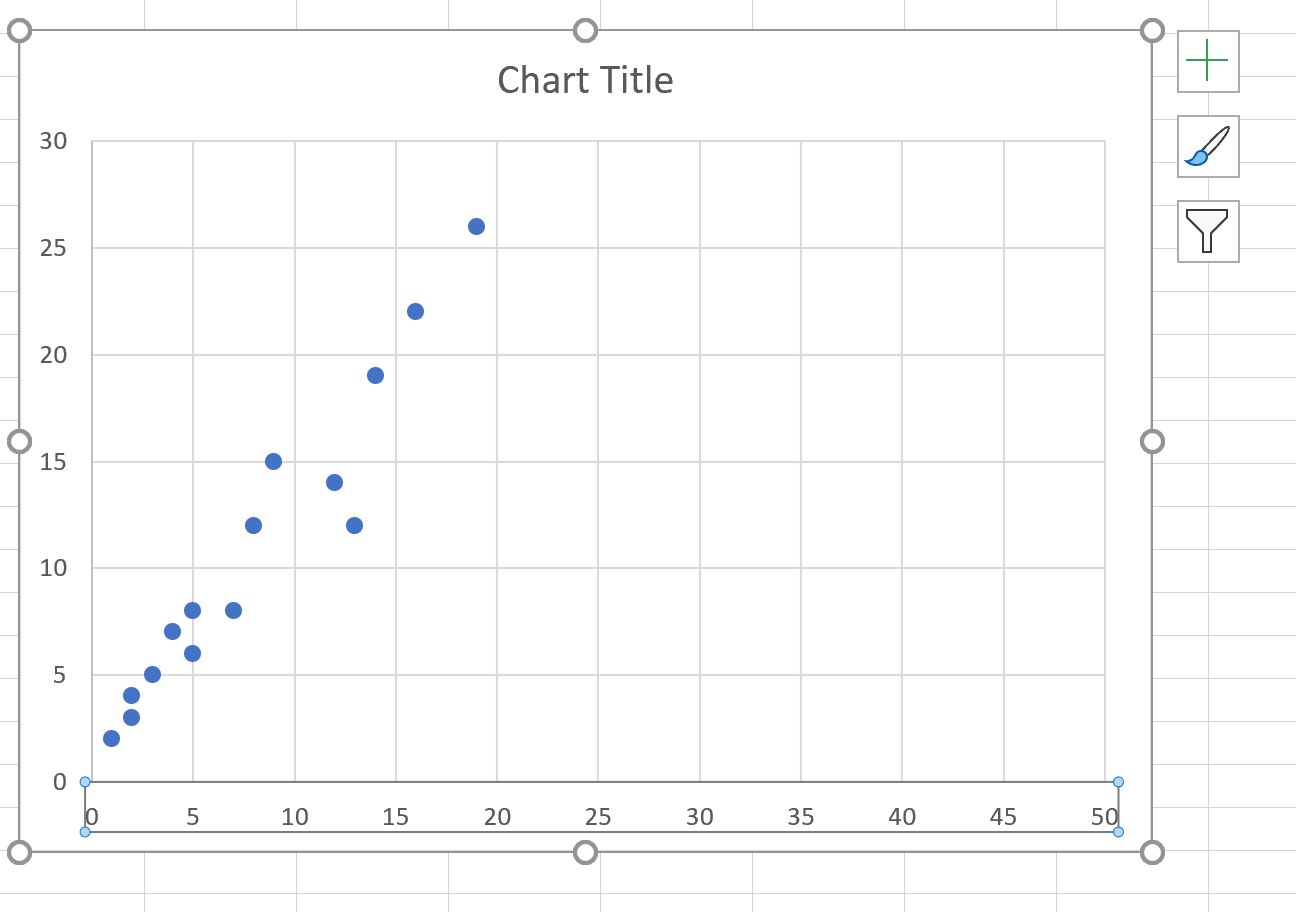
Notice that the x-axis now ranges from 0 to 50.
The y-axis has remained unchanged.
Instead of changing the minimum and maximum bounds, we could also choose to use a logarithmic scale for the axis instead.
In the Format Axis panel, simply check the box next to Logarithmic scale:
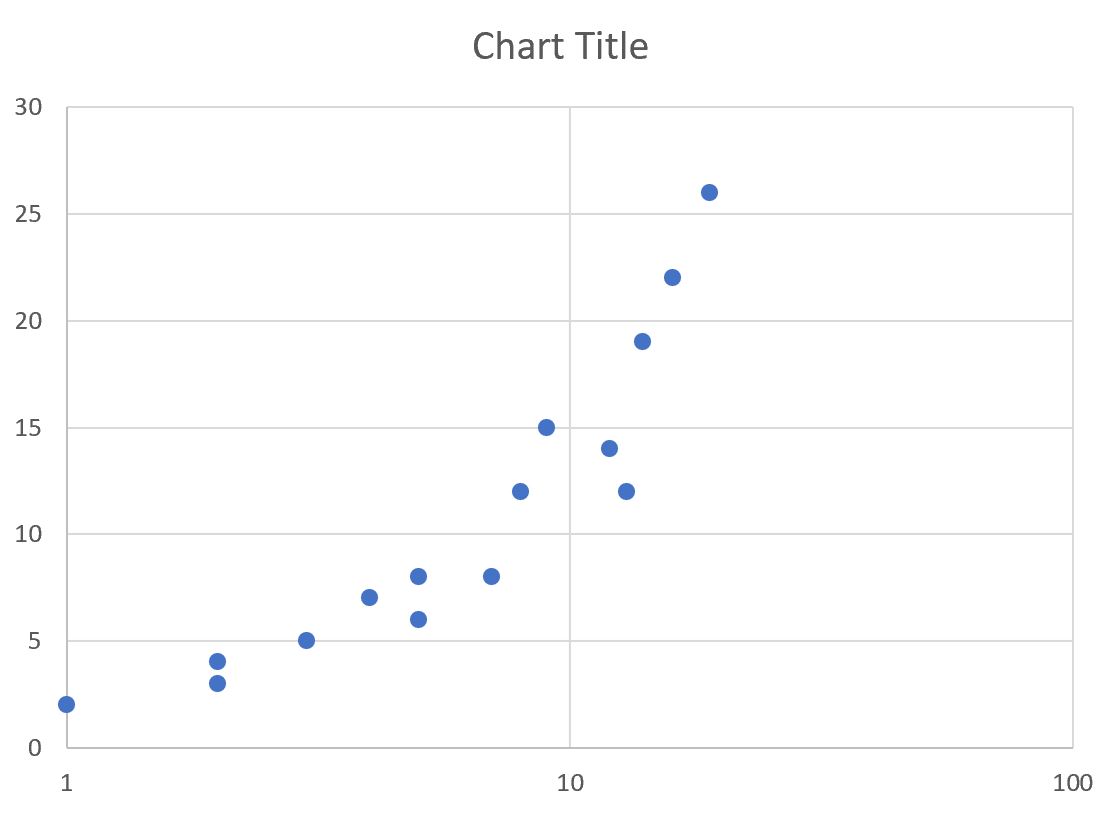
The x-axis will automatically be updated to use a logarithmic scale:
Related: When Should You Use a Log Scale in Charts?
Note that in these examples, we chose to change only the x-axis scale.
However, we can just as easily change the y-axis scale by right-clicking on any of the values on the y-axis and performing the same steps as above.
Additional Resources
The following tutorials explain how to perform other common tasks in Excel:
How to Plot Multiple Lines in Excel
How to Create Side-by-Side Boxplots in Excel
How to Create an Ogive Graph in Excel