You can use the color and fill arguments to change the border and fill color of points in a ggplot2 scatter plot, respectively:
#create scatter plot with points that have black border and pink fill
ggplot(df, aes(x=x, y=y)) +
  geom_point(color='black', fill='pink', shape=21)
It’s important to note that the color and fill arguments only work when the shape value is between 21 and 25.
Refer to this tutorial for a complete list of shapes available in ggplot2.
The following examples show how to use the color and fill arguments in practice.
Example 1: Specify One Fill and Border Color for All Points
The following code shows how to create a scatter plot in ggplot2 in which the border color of all points is black and the fill color is pink:
library(ggplot2)

#create data frame
df frame(x=c(1, 2, 4, 7, 7, 10),
                 y=c(5, 8, 10, 14, 13, 19))

#create scatter plot
ggplot(df, aes(x=x, y=y)) +
  geom_point(color='black', fill='pink', shape=21, size=4)

Example 2: Specify Multiple Fill and Border Colors for Points
The following code shows how to create a scatter plot in ggplot2 in which the border and fill color of points is dependent on the value of a grouping variable:
library(ggplot2)

#create data frame
df frame(x=c(1, 2, 4, 7, 7, 10),
                 y=c(5, 8, 10, 14, 13, 19),
                 group=c('A', 'A', 'A', 'B', 'B', 'B'))

#create scatter plot with multiple fill and border colors
ggplot(df, aes(x=x, y=y)) +
  geom_point(color='black', shape=21, size=4, aes(fill=factor(group))) +
  scale_fill_manual(values=c('pink', 'lightgreen'))
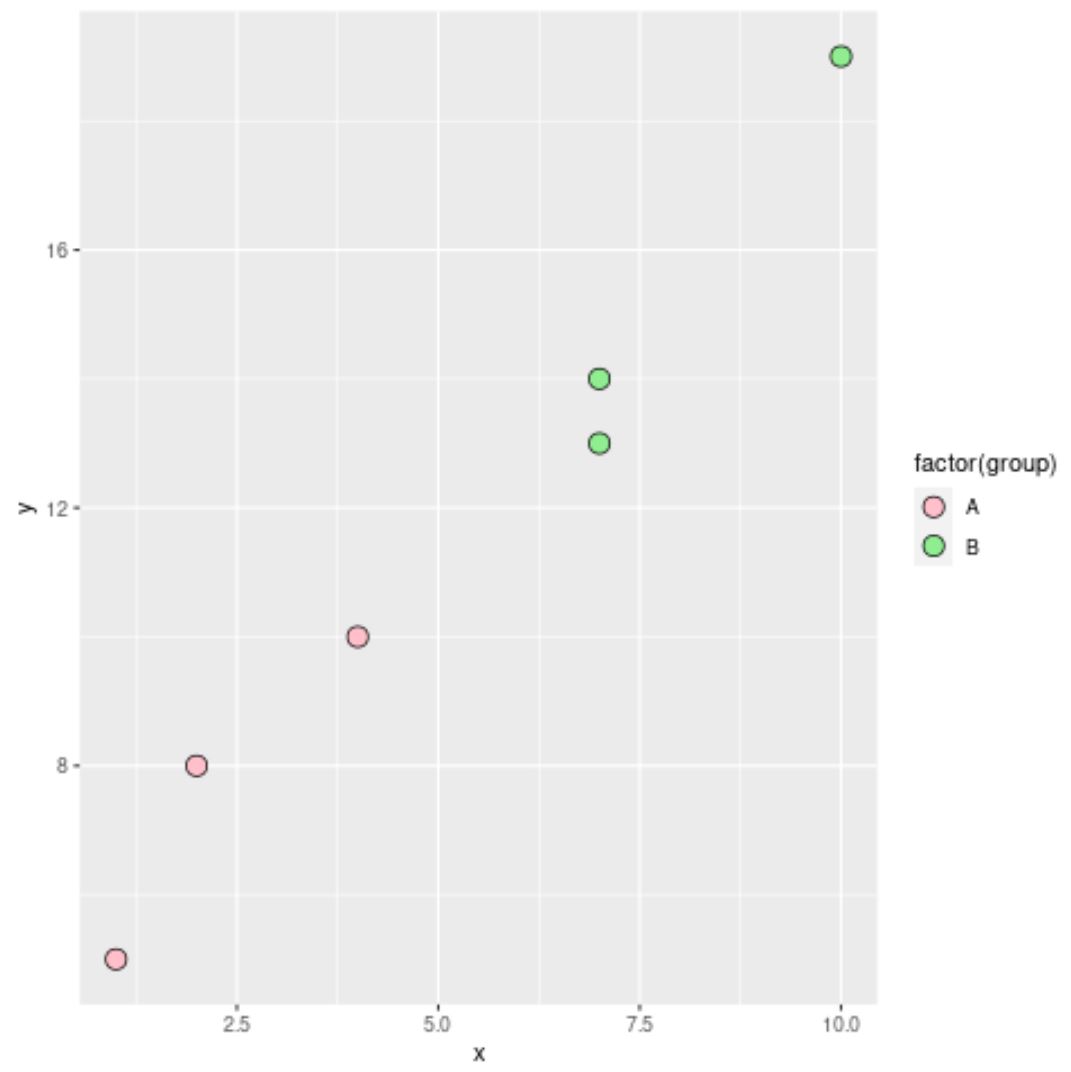
In this example, we use a border color of ‘black’ for all points, but the fill color was dependent on the value for the group variable in the data frame.
Note: You can find the complete documentation for the geom_point() function here.
Additional Resources
The following tutorials explain how to perform other common operations in ggplot2:
How to Change Point Shape in ggplot2
How to Change the Legend Title in ggplot2
How to Rotate Axis Labels in ggplot2
How to Fix in R: could not find function “ggplot”