You can use the following methods to add a caption to plots in ggplot2:
Method 1: Add Caption in Default Location
p +
  labs(caption = "This is my caption")
Method 2: Add Caption in Custom Location
p +
  labs(caption = "This is my caption") +
  theme(plot.caption = element_text(hjust=0))
Method 3: Add Caption & Customize Text
p +
  labs(caption = "This is my caption") +
  theme(plot.caption = element_text(size=16, color="red", face="italic"))
The following examples show how to use each method in practice with the following data frame in R:
#create data frame
df frame(assists=c(1, 2, 2, 3, 5, 6, 7, 8, 8),
                 points=c(3, 6, 9, 14, 20, 23, 16, 19, 26))

#view data frame
df

  assists points
1       1      3
2       2      6
3       2      9
4       3     14
5       5     20
6       6     23
7       7     16
8       8     19
9       8     26
Example 1: Add Caption in Default Location
The following code shows how to create a scatter plot in gglot2 and add a caption in the default location (bottom right corner below plot):
library(ggplot2)

#create scatter plot with caption in bottom left corner
ggplot(df, aes(x=assists, y=points)) +
  geom_point(size=3) +
labs(caption = "Based on 2022 Basketball Data") 
Notice that a caption has been added to the bottom right corner outside the plot.
Example 2: Add Caption in Custom Location
The following code shows how to create a scatter plot in gglot2 and add a caption in the bottom left corner below the plot:
library(ggplot2)

#create scatter plot with caption in default location
ggplot(df, aes(x=assists, y=points)) +
  geom_point(size=3) +
  labs(caption = "Based on 2022 Basketball Data") +
theme(plot.caption = element_text(hjust=0)) 
Notice that a caption has been added to the bottom left corner outside the plot.
Note: You can specify hjust=0.5 to place the caption in the bottom center outside the plot.
Related: How to Use hjust & vjust to Move Elements in ggplot2
Example 3: Add Caption & Customize Text
The following code shows how to create a scatter plot in gglot2 and add a caption with a custom color, font size, and style:
library(ggplot2)

#create scatter plot with caption in default location
ggplot(df, aes(x=assists, y=points)) +
  geom_point(size=3) +
  labs(caption = "Based on 2022 Basketball Data") +
theme(plot.caption = element_text(size=16, color="red", face="italic")) 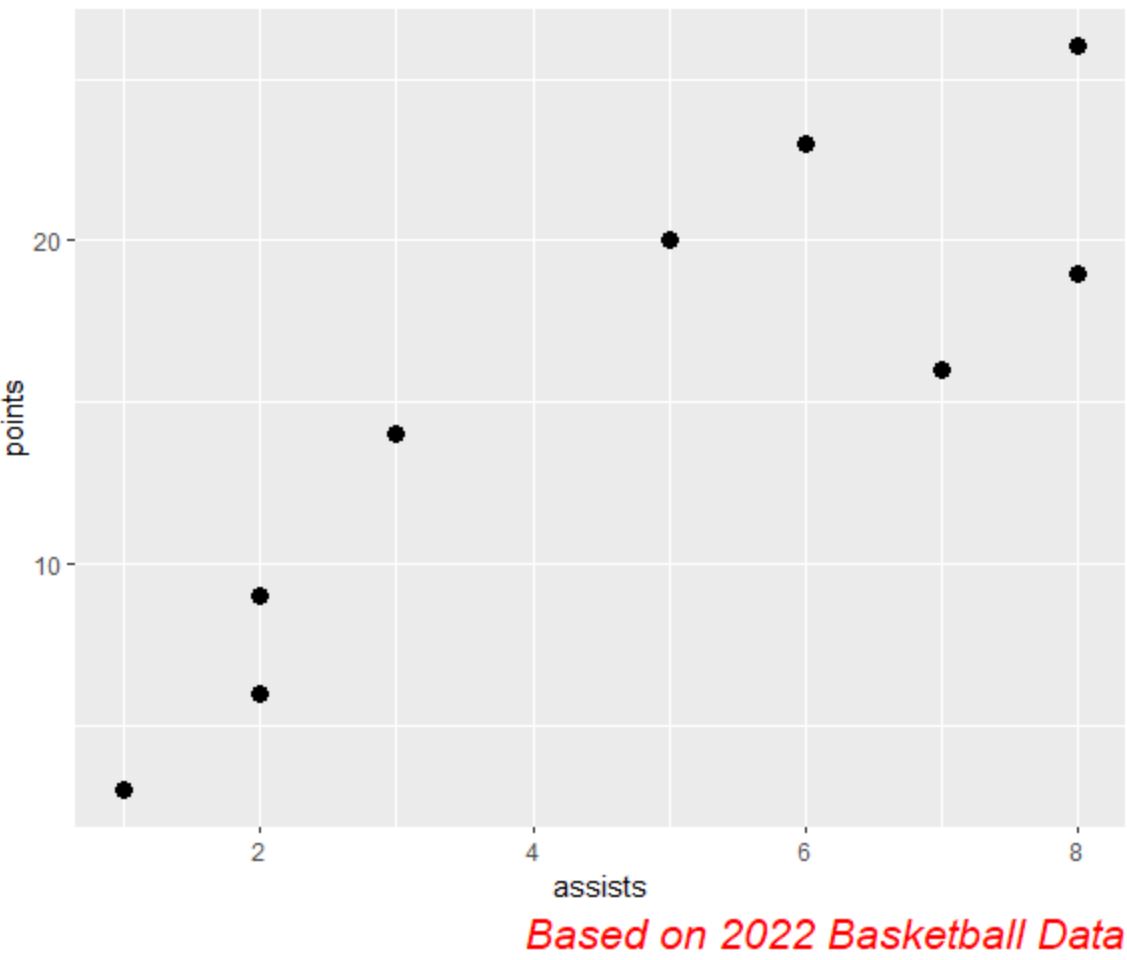
Notice that a caption has been added to the bottom right corner outside the plot with a custom color, font size, and style.
Additional Resources
The following tutorials explain how to perform other common tasks in ggplot2:
How to Change Font Size in ggplot2
How to Remove a Legend in ggplot2
How to Rotate Axis Labels in ggplot2