You can use the following syntax to remove a legend from a plot in ggplot2:
ggplot(df, aes(x=x, y=y, color=z)) +
  geom_point() +
  theme(legend.position="none")
By specifying legend.position=”none” you’re telling ggplot2 to remove all legends from the plot.
The following step-by-step example shows how to use this syntax in practice.
Step 1: Create the Data Frame
First, let’s create a data frame:
#create data frame
df frame(assists=c(3, 4, 4, 3, 1, 5, 6, 7, 9),
                 points=c(14, 8, 8, 16, 3, 7, 17, 22, 26),
                 position=rep(c('Guard', 'Forward', 'Center'), times=3))

#view data frame
df

  assists points position
1       3     14    Guard
2       4      8  Forward
3       4      8   Center
4       3     16    Guard
5       1      3  Forward
6       5      7   Center
7       6     17    Guard
8       7     22  Forward
9       9     26   Center
Step 2: Create a Plot Using ggplot2
Next, let’s use ggplot2 to create a simple scatterplot:
library(ggplot2)

#create scatterplot
ggplot(df, aes(x=assists, y=points, color=position)) +
  geom_point(size=3)

By default, ggplot2 includes a legend so that it’s easier to interpret the colors in the scatterplot.
Step 3: Remove the Legend from the Plot
Next, let’s use legend.position=”none” to remove the legend from the plot:
library(ggplot2)

#create scatterplot with no legend
ggplot(df, aes(x=assists, y=points, color=position)) +
  geom_point(size=3) +
theme(legend.position="none") 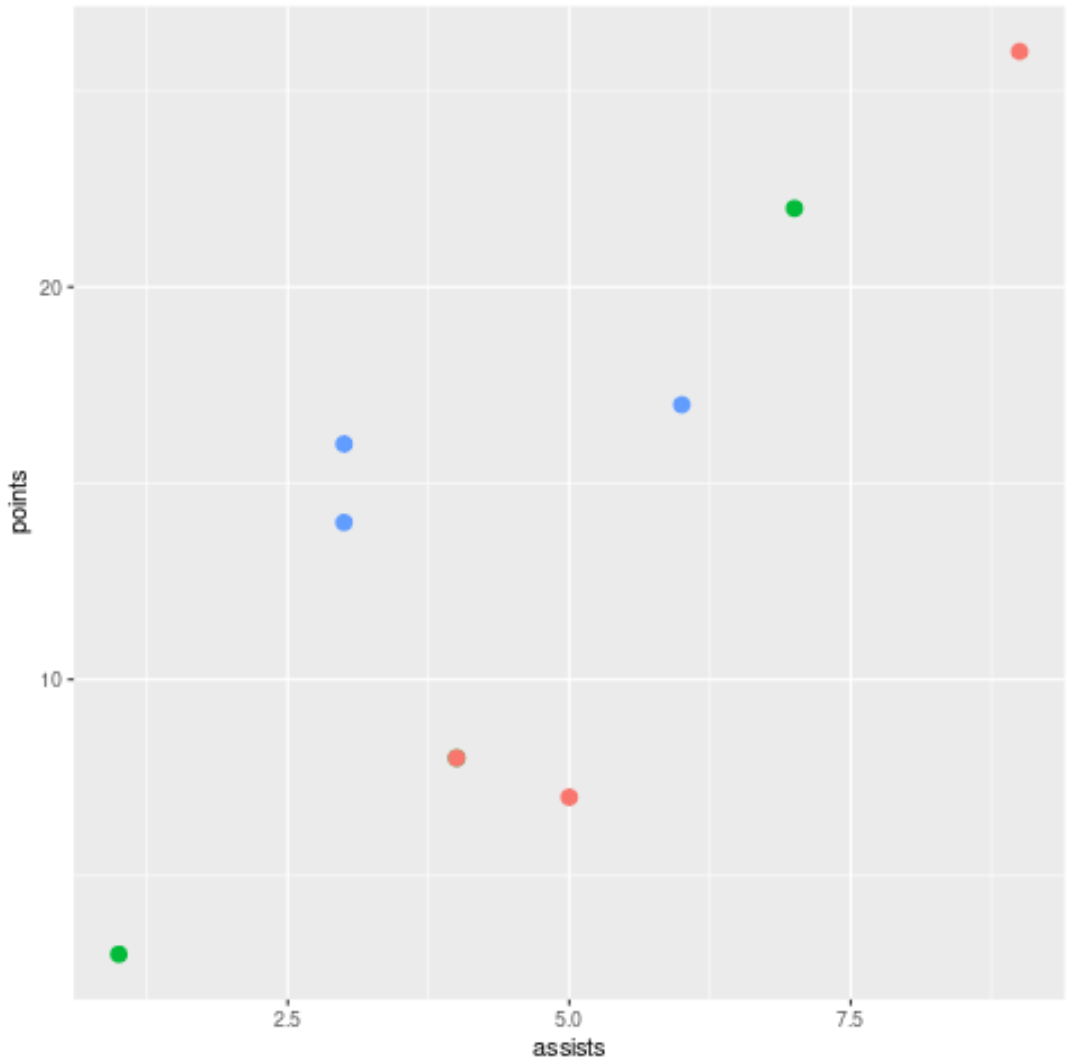
The legend has been completely removed from the plot.
Related: How to Change Legend Labels in ggplot2
Additional Resources
The following tutorials explain how to perform other common operations in ggplot2:
How to Change the Legend Title in ggplot2
How to Change Legend Size in ggplot2
How to Change Legend Position in ggplot2