You can use the size argument to change the size of points in a ggplot2 scatterplot:
some_ggplot +
  geom_point(size=1.5)
The default size is 1.5 but you can decrease or increase this value to make the points smaller or larger.
The following examples show how to use each method in practice with the built-in mtcars dataset in R.
For reference, here’s what a ggplot2 scatterplot looks like using the default size:
library(ggplot2)

ggplot(data=mtcars, aes(x=mpg, y=wt)) +
  geom_point()

Example 1: Increase Point Size in ggplot2
The following code shows how to create a scatterplot in ggplot2 and increase the point size by using the size argument:
library(ggplot2)

#create scatterplot with increased point size
ggplot(data=mtcars, aes(x=mpg, y=wt)) +
geom_point(size=5) 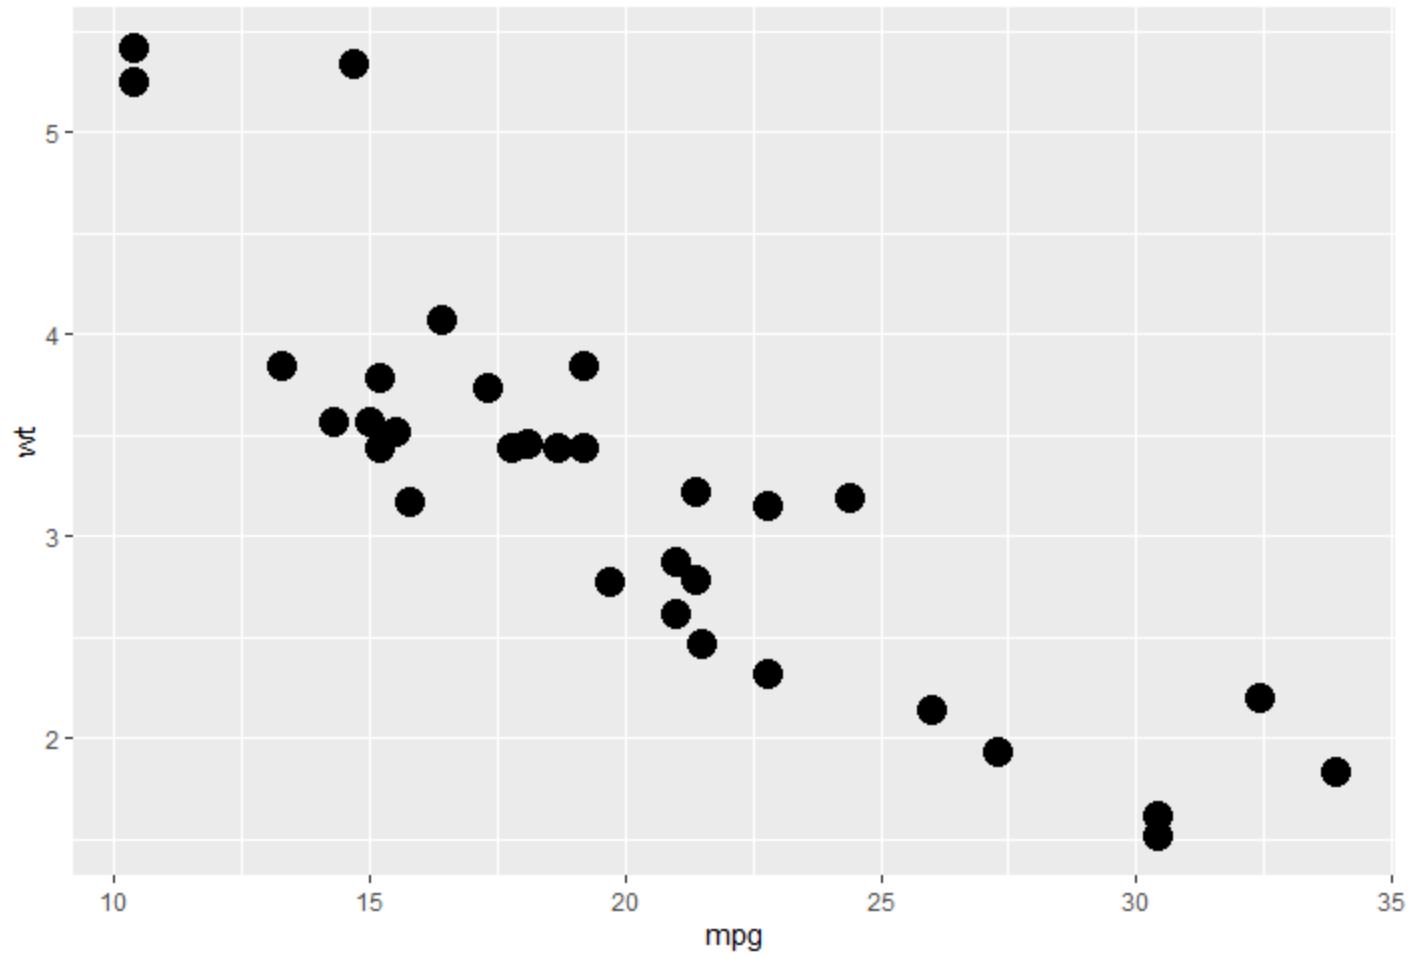
Notice that the points are much larger than the default size.
Example 2: Decrease Point Size in ggplot2
The following code shows how to create a scatterplot in ggplot2 and decrease the point size by using the size argument:
library(ggplot2)

#create scatterplot with decreased point size
ggplot(data=mtcars, aes(x=mpg, y=wt)) +
geom_point(size=0.5) 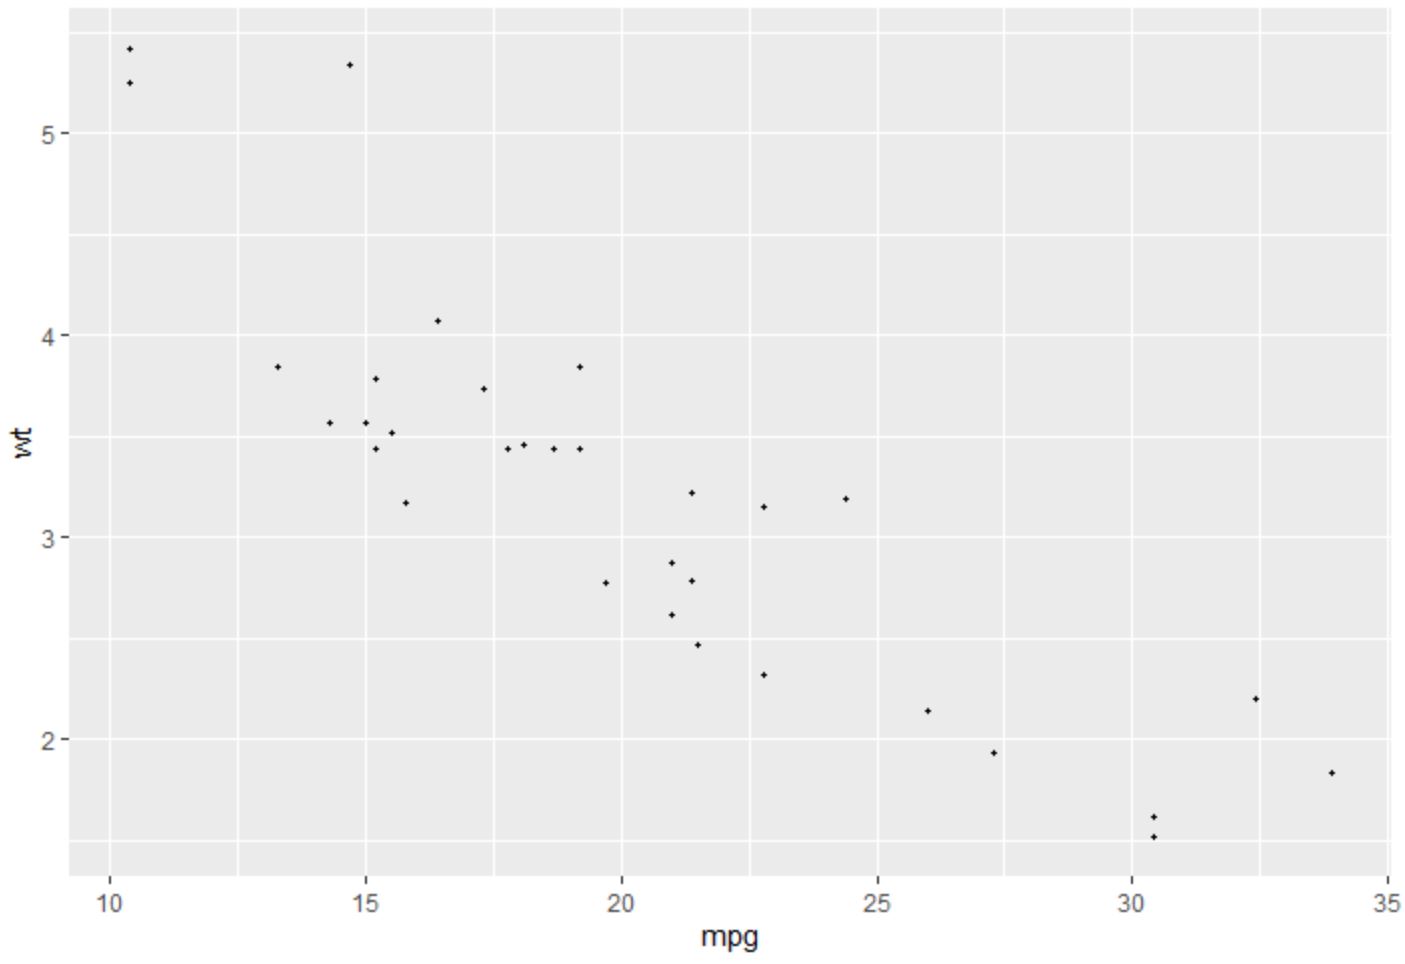
Notice that the points are much smaller than the default size.
Example 3: Adjust Point Size Based on Variable
The following code shows how to create a scatterplot in ggplot2 and adjust each point size based on the value of another variable in the mtcars dataset called qsec:
library(ggplot2)

#create scatterplot with point size based on value of qsec
ggplot(data=mtcars, aes(x=mpg, y=wt)) +
  geom_point(aes(size=qsec))

The size of each point is now dependent on the value of the qsec variable.
Notice that ggplot2 also automatically adds a legend on the right side of the plot to help you understand how the value of the qsec variable is mapped onto the size of each point.
Note: You can find the complete documentation for the geom_point() function here.
Additional Resources
The following tutorials explain how to perform other common operations in ggplot2:
How to Change Point Shape in ggplot2
How to Change the Legend Title in ggplot2
How to Rotate Axis Labels in ggplot2
How to Fix in R: could not find function “ggplot”