-
MATLAB Tutorial
- matlab-tutorial
- matlab-introduction
- platform-features
- prerequisites-system-requirements
- matlab-downloading
- matlab-installation
- matlab-online
- advantage-disadvantage
- matlab-commands
- matlab-environment
- working-with-variables-arrays
- workspace,-variables,-functions
- matlab-data-types
- matlab-operator
- formatting-text
Control Statements
- if...end-statement
- if-else...-end-statement
- if-elseif-else...end-statement
- nested-if-else
- matlab-switch
MATLAB Loops
Statement-try, catch
Program Termination
Arrays & Functions
- matlab-matrices-arrays
- multi-dimensional-arrays
- matlab-compatible-array
- matlab-sparse-matrices
- matlab-m-files
- matlab-functions
- anonymous-function
MATLAB Graphics
MATLAB 2D Plots
- matlab-fplot()
- matlab-semilogx()
- matlab-semilogy()
- matlab-loglog()
- matlab-polar-plots()
- matlab-fill()
- matlab-bar()
- matlab-errorbar()
- matlab-barh()
- matlab-plotyy()
- matlab-area()
- matlab-pie()
- matlab-hist()
- matlab-stem()
- matlab-stairs()
- matlab-compass()
- matlab-comet()
- matlab-contour()
- matlab-quiver()
- matlab-pcolor()
MATLAB 3D Plots
- matlab-3d-plots
- matlab-plot3()
- matlab-fill3()
- matlab-contour3()
- matlab-surf()
- matlab-surfc()
- matlab-mesh()
- matlab-meshz()
- matlab-waterfall()
- matlab-stem3()
- matlab-ribbon()
- matlab-sphere()
- matlab-ellipsoid()
- matlab-cylinder()
- matlab-slice()
Linear Algebra
Symbolic Mathematics
MATLAB Polynomial
Numerical Integration
- numerical-integration
- matlab-double-integral
- matlab-trapezoidal-rule
- matlab-trapz
- matlab-simpson's-rule
MATLAB GUI
MATLAB Programs
- environment-programming
- matlab-variables
- operations-on-matrices
- control-statements
- matlab-2-d-plots
- matlab-sine-wave-plot
Interview Questions
MATLAB 2-D PlotsObjective: To study graphics, i.e., 2-D plots, printing labels, grid and axis box, text in plot, bar, and pie chart. ExampleOutput: 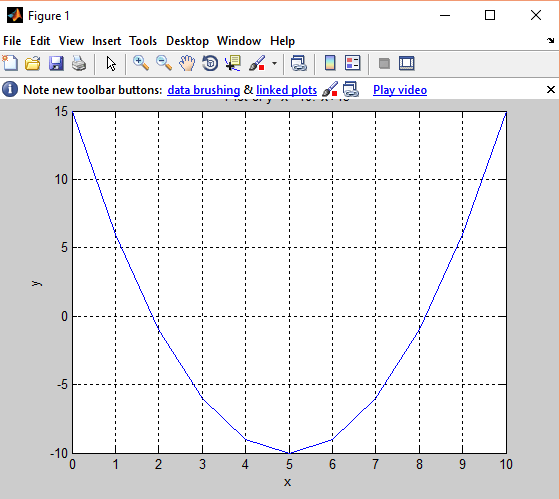 Multiple plots:ExamplesOutput: 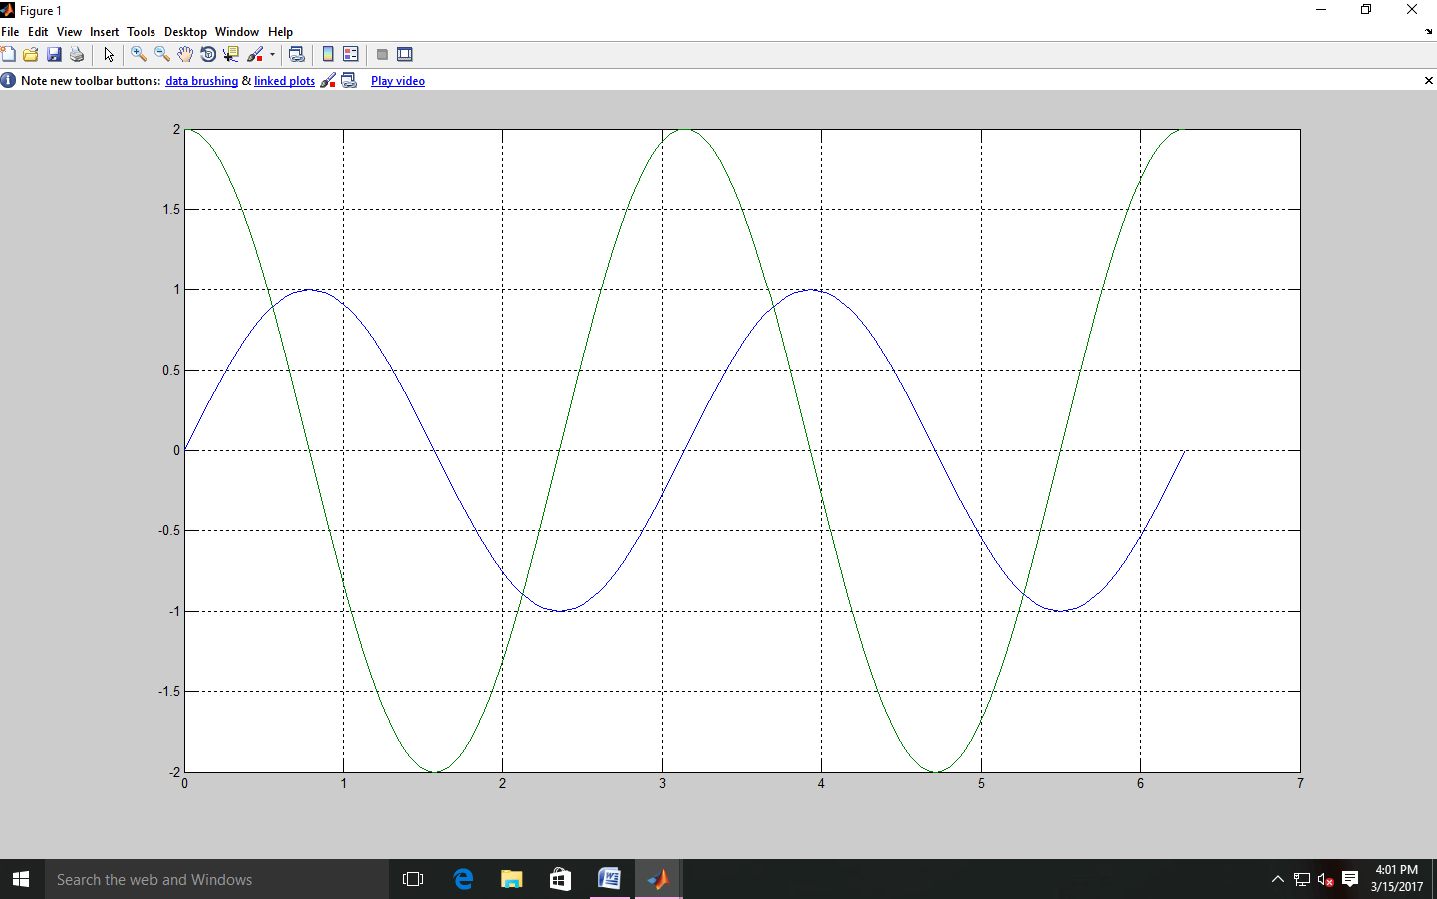 Line color, Line style, Marker style, and legends:
y
m
c
r
g
b
w
k
. → point
o → circle
x → x-mark
+ → plus
*→ star
s → square
d → diamond
v → triangle(left)
^ → triangle(up)
< → triangle(left)
>→ triangle(right)
p → pentagon
h → hexagon
- → solid -. → dashed dot -- →dashed .. → dotted TITLE: Title ('title_string', 'Font Name', Helvetica','Font Size',20.'color','green','Font Weight','light/bold/normal','Font Angle','Normal/italic'); AXES: Axes('Position',[left, bottom,width,height]) E.g.: To create axes at (0.2,0.2), size half of the figure window. axes ('Position', [.2 .2 .5 .5]);  TEXT: To add a text string to a specified location in the plot area. text(r,c,'string'); GTEXT: need not to specify text location. gtext('string'); where we click, the text will be displayed there. LEGEND: Position of legend: top left top center top right ExampleOutput: 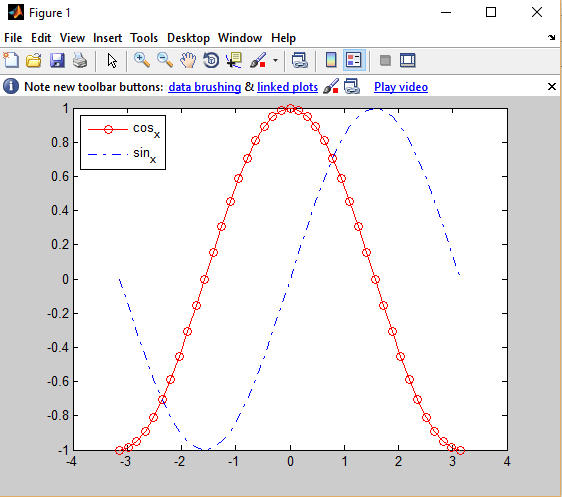 Statistical plots:pie(x):Example Output: 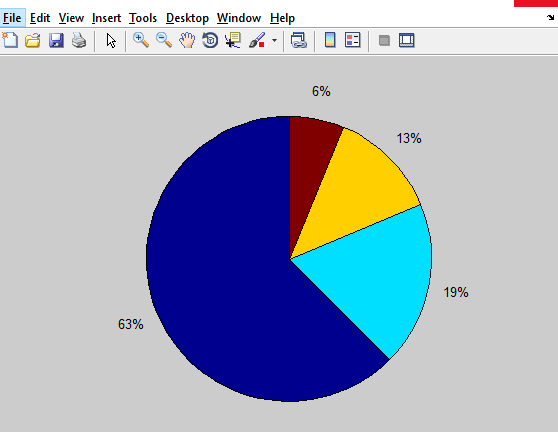 To pull out 3rd slide: Example Output: 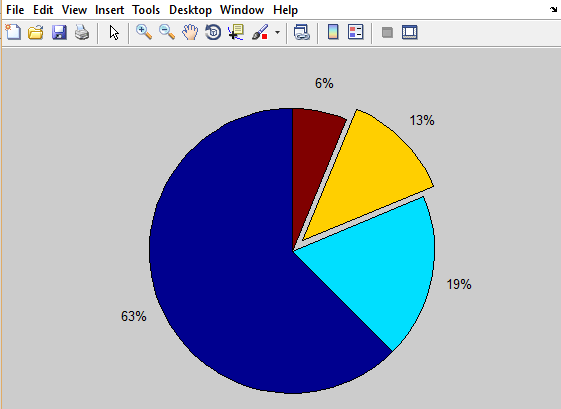 To pull text labels: Example Output: 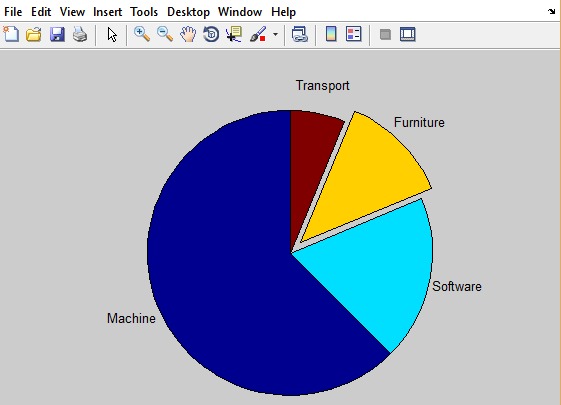 Bar graphs:bar(x): It plots the bar. Plot the values of x against the time index. bar(t,x): if we want to give t by ourselves. Example Output: 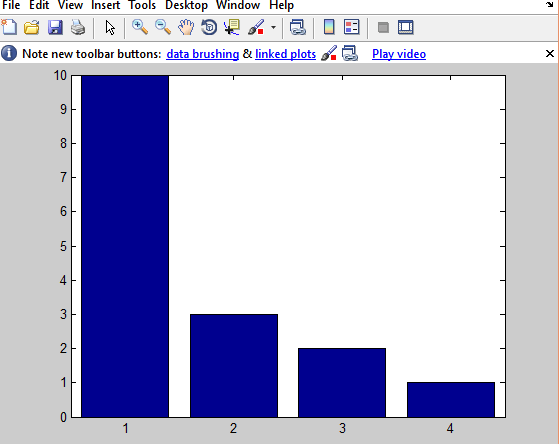 bar(x,'stacked'): Output: 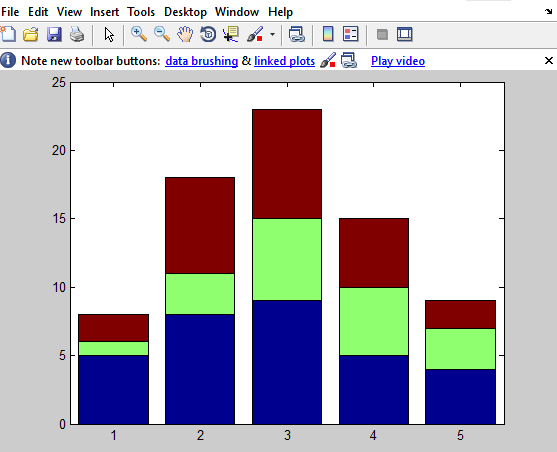 Print command: options:
E.g.: print -djpeg myimg.jpeg Next TopicMATLAB Sine Wave Plot
|