-
MATLAB Tutorial
- matlab-tutorial
- matlab-introduction
- platform-features
- prerequisites-system-requirements
- matlab-downloading
- matlab-installation
- matlab-online
- advantage-disadvantage
- matlab-commands
- matlab-environment
- working-with-variables-arrays
- workspace,-variables,-functions
- matlab-data-types
- matlab-operator
- formatting-text
Control Statements
- if...end-statement
- if-else...-end-statement
- if-elseif-else...end-statement
- nested-if-else
- matlab-switch
MATLAB Loops
Statement-try, catch
Program Termination
Arrays & Functions
- matlab-matrices-arrays
- multi-dimensional-arrays
- matlab-compatible-array
- matlab-sparse-matrices
- matlab-m-files
- matlab-functions
- anonymous-function
MATLAB Graphics
MATLAB 2D Plots
- matlab-fplot()
- matlab-semilogx()
- matlab-semilogy()
- matlab-loglog()
- matlab-polar-plots()
- matlab-fill()
- matlab-bar()
- matlab-errorbar()
- matlab-barh()
- matlab-plotyy()
- matlab-area()
- matlab-pie()
- matlab-hist()
- matlab-stem()
- matlab-stairs()
- matlab-compass()
- matlab-comet()
- matlab-contour()
- matlab-quiver()
- matlab-pcolor()
MATLAB 3D Plots
- matlab-3d-plots
- matlab-plot3()
- matlab-fill3()
- matlab-contour3()
- matlab-surf()
- matlab-surfc()
- matlab-mesh()
- matlab-meshz()
- matlab-waterfall()
- matlab-stem3()
- matlab-ribbon()
- matlab-sphere()
- matlab-ellipsoid()
- matlab-cylinder()
- matlab-slice()
Linear Algebra
Symbolic Mathematics
MATLAB Polynomial
Numerical Integration
- numerical-integration
- matlab-double-integral
- matlab-trapezoidal-rule
- matlab-trapz
- matlab-simpson's-rule
MATLAB GUI
MATLAB Programs
- environment-programming
- matlab-variables
- operations-on-matrices
- control-statements
- matlab-2-d-plots
- matlab-sine-wave-plot
Interview Questions
MATLAB plotyy()It creates graphs with y-axes on both the left and right sides. SyntaxExampleOutput: 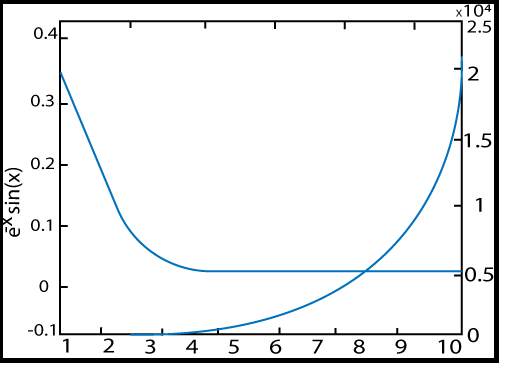
Next TopicMATLAB area()
|