-
MATLAB Tutorial
- matlab-tutorial
- matlab-introduction
- platform-features
- prerequisites-system-requirements
- matlab-downloading
- matlab-installation
- matlab-online
- advantage-disadvantage
- matlab-commands
- matlab-environment
- working-with-variables-arrays
- workspace,-variables,-functions
- matlab-data-types
- matlab-operator
- formatting-text
Control Statements
- if...end-statement
- if-else...-end-statement
- if-elseif-else...end-statement
- nested-if-else
- matlab-switch
MATLAB Loops
Statement-try, catch
Program Termination
Arrays & Functions
- matlab-matrices-arrays
- multi-dimensional-arrays
- matlab-compatible-array
- matlab-sparse-matrices
- matlab-m-files
- matlab-functions
- anonymous-function
MATLAB Graphics
MATLAB 2D Plots
- matlab-fplot()
- matlab-semilogx()
- matlab-semilogy()
- matlab-loglog()
- matlab-polar-plots()
- matlab-fill()
- matlab-bar()
- matlab-errorbar()
- matlab-barh()
- matlab-plotyy()
- matlab-area()
- matlab-pie()
- matlab-hist()
- matlab-stem()
- matlab-stairs()
- matlab-compass()
- matlab-comet()
- matlab-contour()
- matlab-quiver()
- matlab-pcolor()
MATLAB 3D Plots
- matlab-3d-plots
- matlab-plot3()
- matlab-fill3()
- matlab-contour3()
- matlab-surf()
- matlab-surfc()
- matlab-mesh()
- matlab-meshz()
- matlab-waterfall()
- matlab-stem3()
- matlab-ribbon()
- matlab-sphere()
- matlab-ellipsoid()
- matlab-cylinder()
- matlab-slice()
Linear Algebra
Symbolic Mathematics
MATLAB Polynomial
Numerical Integration
- numerical-integration
- matlab-double-integral
- matlab-trapezoidal-rule
- matlab-trapz
- matlab-simpson's-rule
MATLAB GUI
MATLAB Programs
- environment-programming
- matlab-variables
- operations-on-matrices
- control-statements
- matlab-2-d-plots
- matlab-sine-wave-plot
Interview Questions
MATLAB 2-D PlotsThere are many specific graphics functions for 2-D plotting. They are used as alternatives to the plot command we have just discussed. MATLAB help desk lists more than 20 types of two-dimensional plots. Examples include stem plots, stair plots, bar plots, pie plots, and compass plots. Here we are going to discuss the 2D plotting function in MATLAB. MATLAB fplot()It is used to plot between the specific limit. The function must be of form y=f(x), where x is the vector whose specifies the limits, and y is the vector with the same size as x. SyntaxExampleOutput: 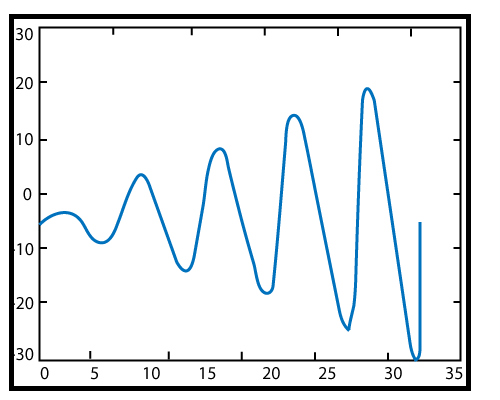
Next TopicMATLAB Semilogx()
|