You can use the following syntax to specify the position of a ggplot2 legend:
theme(legend.position = "right")
The following examples show how to use this syntax in practice with the built-in iris dataset in R.
Example: Place Legend On Outside of Plot
You can directly tell ggplot2 to place the legend on the “top”, “right”, “bottom” or “left” side of the plot.
For example, here’s how to place the legend on the top of the plot:
library(ggplot2)

ggplot(iris, aes(x=Sepal.Length, y=Sepal.Width, color=Species)) +
       geom_point() +
       theme(legend.position = "top")

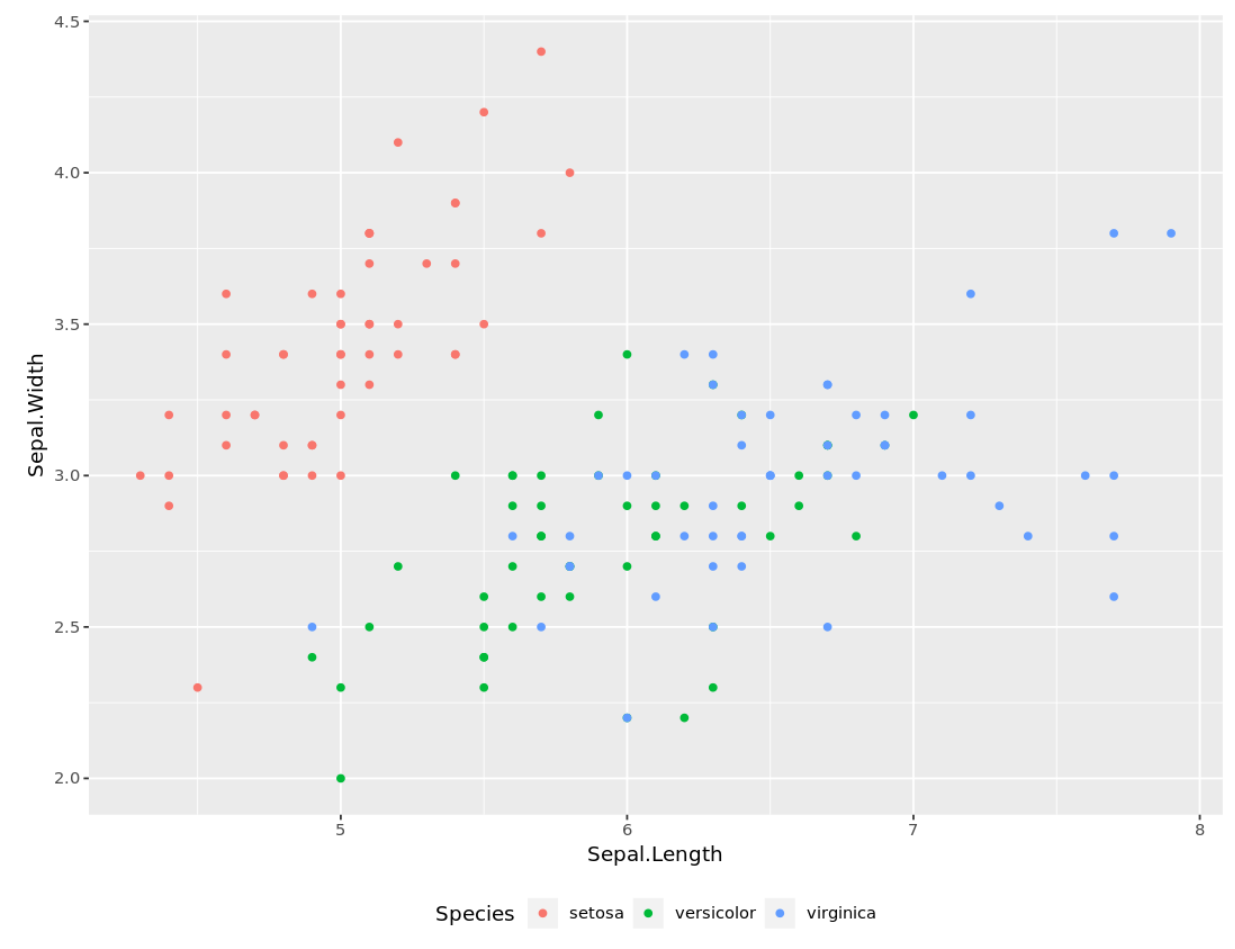
And here’s how to place the legend on the bottom of the plot:
library(ggplot2)

ggplot(iris, aes(x=Sepal.Length, y=Sepal.Width, color=Species)) +
       geom_point() +
       theme(legend.position = "bottom")
Example: Place Legend On Inside of Plot
You can also specify the exact (x, y) coordinates to place the legend on the inside of the plot.
For example, here’s how to place the legend inside the top right corner:
library(ggplot2)

ggplot(iris, aes(x=Sepal.Length, y=Sepal.Width, color=Species)) +
       geom_point() +
       theme(legend.position = c(.9, .9))

And here’s how to place the legend inside the bottom right corner:
library(ggplot2)

ggplot(iris, aes(x=Sepal.Length, y=Sepal.Width, color=Species)) +
       geom_point() +
       theme(legend.position = c(.9, .1))

Example: Remove Legend Completely
You can also remove the legend from a plot in ggplot2 entirely by specifying legend.position=”none” as follows:
library(ggplot2)

ggplot(iris, aes(x=Sepal.Length, y=Sepal.Width, color=Species)) +
       geom_point() +
       theme(legend.position = "none")

Additional Resources
How to Change Legend Size in ggplot2
How to Change the Legend Title in ggplot2
A Complete Guide to the Best ggplot2 Themes