-
JavaScript Tutorial
JavaScript Basics
- js-comment
- js-variable
- js-global-variable
- js-data-types
- js-operators
- js-if-statement
- js-switch
- js-loop
- js-function
JavaScript Objects
JavaScript BOM
JavaScript DOM
- 5)-document-object
- getelementbyid
- getelementsbyclassname()
- getelementsbyname
- getelementsbytagname
- js-innerhtml-property
- js-innertext-property
JavaScript Validation
JavaScript OOPs
- js-class
- js-object
- js-prototype
- js-constructor-method
- js-static-method
- js-encapsulation
- js-inheritance
- js-polymorphism
- js-abstraction
JavaScript Cookies
JavaScript Events
- javascript-events
- javascript-addeventlistener()
- js-onclick-event
- js-dblclick-event
- js-onload-event
- js-onresize-event
Exception Handling
JavaScript Misc
- js-this-keyword
- js-debugging
- js-hoisting
- js-strict-mode
- javascript-promise
- js-compare-dates
- javascript-array.length
- javascript-alert()
- javascript-eval()-function
- javascript-closest()
- javascript-continue-statement
- js-getattribute()-method
- js-hide-elements
- javascript-prompt()
- removeattribute()-method
- javascript-reset
- javascript-return
- js-string-split()
- js-typeof-operator
- js-ternary-operator
- js-reload()-method
- js-setattribute()-method
- js-setinterval()-method
- js-settimeout()-method
- js-string-includes()-method
- calculate-current-week-number-in-javascript
- calculate-days-between-two-dates-in-javascript
- javascript-string-trim()
- javascript-timer
- remove-elements-from-array
- javascript-localstorage
- javascript-offsetheight
- confirm-password-validation
- static-vs-const
- how-to-convert-comma-separated-string-into-an-array-in-javascript
- calculate-age-using-javascript
- javascript-label-statement
- javascript-string-with-quotes
- how-to-create-dropdown-list-using-javascript
- how-to-disable-radio-button-using-javascript
JavaScript Advance
- js-typedarray
- js-set
- js-map
- js-weakset
- js-weakmap
- javascript-callback
- javascript-closures
- javascript-date-difference
- javascript-date-format
- js-date-parse()-method
- javascript-defer
- javascript-redirect
- javascript-scope
- javascript-scroll
- javascript-sleep
- javascript-void
- javascript-form
Differences
Questions
- how-to-add-javascript-to-html
- how-to-enable-javascript-in-my-browser
- difference-between-java-and-javascript
- how-to-call-javascript-function-in-html
- how-to-write-a-function-in-javascript
- is-javascript-case-sensitive
- how-does-javascript-work
- how-to-debug-javascript
- how-to-enable-javascript-on-android
- what-is-a-promise-in-javascript
- what-is-hoisting-in-javascript
- what-is-vanilla-javascript
- how-to-add-a-class-to-an-element-using-javascript
- how-to-calculate-the-perimeter-and-area-of-a-circle-using-javascript
- how-to-create-an-image-map-in-javascript
- how-to-find-factorial-of-a-number-in-javascript
- how-to-get-the-value-of-pi-using-javascript
- how-to-make-a-text-italic-using-javascript
- what-are-the-uses-of-javascript
- how-to-get-all-checked-checkbox-value-in-javascript
- how-to-open-json-file
- random-image-generator-in-javascript
- how-to-add-object-in-array-using-javascript
- javascript-window-open-method
- javascript-window-close-method
- how-to-check-a-radio-button-using-javascript
- javascript-const
- javascript-function-to-check-array-is-empty-or-not
- javascript-multi-line-string
- javascript-anonymous-functions
- implementing-javascript-stack-using-array
- javascript-classlist
- javascript-code-editors
- javascript-let-keyword
- random-string-generator-using-javascript
- javascript-queue
- event-bubbling-and-capturing-in-javascript
- how-to-select-all-checkboxes-using-javascript
- javascript-change-event
- javascript-focusout-event
- traverse-array-object-using-javascript
- javascript-create-and-download-csv-file
- how-to-make-beep-sound-in-javascript
- how-to-add-a-whatsapp-share-button-in-a-website-using-javascript
- javascript-execution-context
- javascript-queryselector
- shallow-copy-in-javascript
- how-to-toggle-password-visibility-in-javascript
- removing-duplicate-from-arrays
- javascript-insertbefore
- javascript-select-option
Interview Questions
JavaScript DebuggingSometimes a code may contain certain mistakes. Being a scripting language, JavaScript didn't show any error message in a browser. But these mistakes can affect the output. The best practice to find out the error is to debug the code. The code can be debugged easily by using web browsers like Google Chrome, Mozilla Firebox. JavaScript Debugging ExampleHere, we will find out errors using built-in web browser debugger. To perform debugging, we can use any of the following approaches:
Using console.log() methodThe console.log() method displays the result in the console of the browser. If there is any mistake in the code, it generates the error message. Let's see the simple example to print the result on console. Output: To open the console on browser, press F12 key. 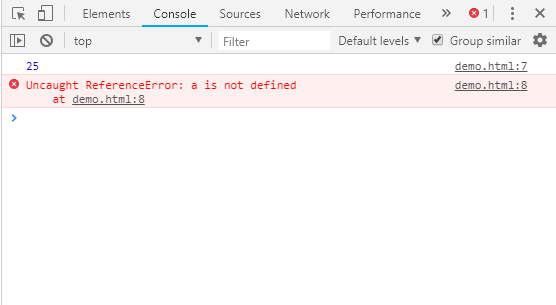 Using debugger keywordIn debugging, generally we set breakpoints to examine each line of code step by step. There is no requirement to perform this task manually in JavaScript. JavaScript provides debugger keyword to set the breakpoint through the code itself. The debugger stops the execution of the program at the position it is applied. Now, we can start the flow of execution manually. If an exception occurs, the execution will stop again on that particular line. Output: 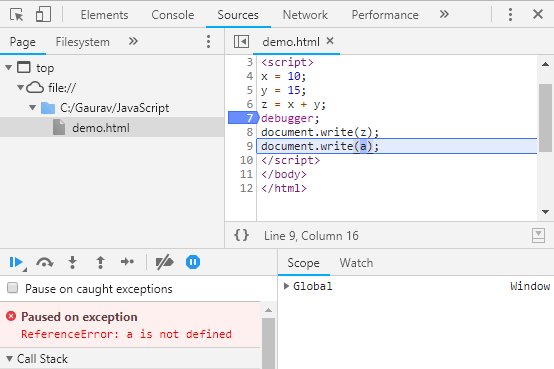
Next TopicJavaScript Hoisting
|